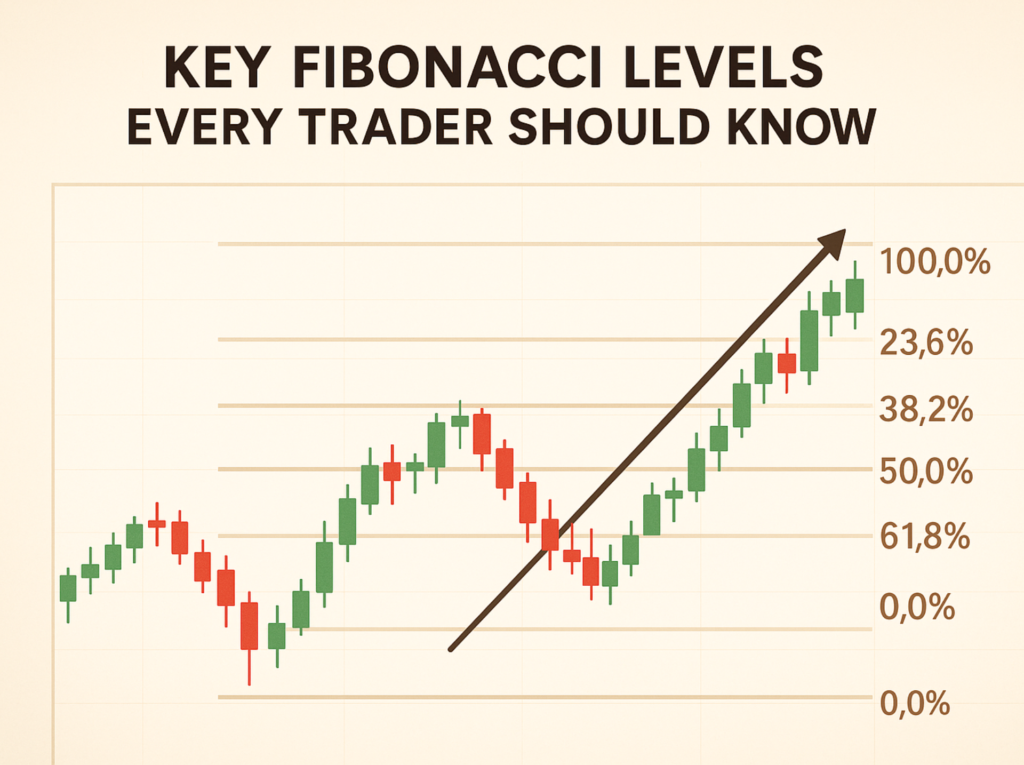
Fibonacci retracement levels are widely used in trading to identify potential support and resistance zones. These levels – 23.6%, 38.2%, 50%, 61.8%, and 78.6% – are based on mathematical ratios derived from the Fibonacci sequence. Traders use them to plan entry and exit points, set stop-loss orders, and determine profit targets. Here’s a quick breakdown:
- 23.6%: Indicates minor pullbacks in strong trends.
- 38.2%: A moderate retracement, often viewed as a “buy-the-dip” zone.
- 50%: A psychological midpoint, though not a Fibonacci ratio.
- 61.8%: Known as the “golden ratio”, it’s a key level for reversals.
- 78.6%: Represents deep pullbacks, often a last defence before trend invalidation.
These levels work best in trending markets and are more reliable when combined with other tools like moving averages, RSI, or candlestick patterns. For example, a stock rising from S$10 to S$20 might retrace to S$16.18 (38.2%) or S$13.82 (61.8%) before resuming its trend.
How Fibonacci Retracement Levels Are Calculated
Fibonacci retracement uses the mathematical principles of the Fibonacci sequence to pinpoint key support and resistance levels in trading. The sequence itself is straightforward: each number is the sum of the two before it – 0, 1, 1, 2, 3, 5, 8, 13, 21, 34, 55, 89, and so on.
When you dig into the sequence, two critical ratios emerge: the golden ratio (approximately 1.618) and its inverse (0.618). As the sequence progresses, dividing a number by its immediate predecessor approaches 1.618. This inverse, 0.618, forms the basis for the prominent 61.8% retracement level.
“The golden ratio is derived by dividing each number of the Fibonacci series by its immediate predecessor… This limit is better known as the golden ratio.” – Investopedia
Breaking Down the Key Ratios
From the sequence, several ratios commonly used in trading appear. These include 23.6%, 38.2%, 50%, and 61.8%. Here’s how they’re derived:
- 38.2%: This comes from dividing a Fibonacci number by the one two places ahead in the sequence.
- 23.6%: This ratio is calculated by dividing a number by the one three places ahead.
- 50%: While not a Fibonacci ratio, it represents a halfway point that traders often monitor.
How to Plot Fibonacci Retracement Levels
To plot retracement levels for any Singapore-listed stock or SGD-denominated asset, you’ll need two key price points: a significant high and a low. The vertical distance between these points is then multiplied by the Fibonacci ratios.
For instance, if a stock moves from S$10.00 to S$20.00:
- The 61.8% retracement level is calculated as S$20.00 – (S$10.00 × 0.618) = S$13.82.
- The 38.2% retracement level is S$20.00 – (S$10.00 × 0.382) = S$16.18.
Example: Real Market Use
Take the S&P 500 e-mini futures in January 2025 as an example. During a one-hour timeframe, the pivot high was 6,162.25, and the pivot low was 5,809. Using Fibonacci retracement, the 61.8% level was calculated at 5,944.00. Traders used this as a potential entry point, placing stop-loss orders slightly below the level and targeting the previous pivot high.
This method isn’t limited to global indices – it works just as well for Singapore bank stocks, REITs, or any SGD-denominated instruments. By understanding the maths behind Fibonacci retracement, you can approach trading with more confidence and spot price levels where the market might naturally react.
1. 23.6% Retracement Level
The 23.6% retracement level is the shallowest pullback in the Fibonacci sequence. It signals a minor correction in strong trends where buying or selling momentum remains dominant, with only limited profit-taking along the way.
Calculating the 23.6% Retracement
This retracement level is determined using a 0.236 multiplier. Let’s break it down with an example: imagine a stock rises from S$10.00 to S$20.00. The total price increase is S$10.00. To calculate the 23.6% retracement, multiply 0.236 by S$10.00, which equals S$2.36. Subtract this from the high (S$20.00), and you get S$17.64 as the retracement level.
Trading Applications and Market Context
The 23.6% retracement is particularly useful in low-volatility markets, where pullbacks are brief and often stall around this level. Traders frequently look for opportunities near this point, especially when other technical signals – like RSI, trend lines, or candlestick patterns – support a potential reversal.
While this level is less impactful than deeper retracements, it’s a favourite for traders employing aggressive trend-following strategies. It’s less suited for counter-trend approaches but can be highly effective during strong directional moves. For those who missed the initial breakout, this shallow pullback often offers an early chance to join the trend at a slightly more favourable price.
Understanding this level sets the stage for exploring how deeper Fibonacci retracements can further enhance your trading strategy.
2. 38.2% Retracement Level
The 38.2% retracement level is another key marker in trending markets, offering valuable insights into price movements. It indicates a moderate pullback while still maintaining momentum. This level is derived from Fibonacci calculations – specifically, dividing a Fibonacci number by the one two places ahead, resulting in approximately 0.3820.
How to Calculate the 38.2% Retracement
The calculation is straightforward. Multiply the price movement by 0.382. For instance, if the Straits Times Index climbs from 3,000 to 3,500 points (a 500-point increase), the retracement would be 500 × 0.382 = 191 points. To find the retracement level in an uptrend, subtract this from the peak: 3,500 – 191 = 3,309 points. This calculated level often serves as a guide for identifying potential buy-the-dip opportunities.
Why It’s Considered a “Buy-the-Dip” Zone
Traders frequently view the 38.2% retracement level as a sweet spot for entering positions during a pullback, especially for those who missed the initial move.
Examples from the Market
Consider Target Corporation (TGT). The stock retraced 38% of its earlier advance. Its first reversal attempt in late June faltered despite positive Chaikin Money Flow. However, a second reversal in mid-July was successful, marked by a gap up and a break above the wedge trend line.
Another example is Petsmart (PETM). Between September and October, the stock experienced a moderate pullback. By November, it rebounded to around US$28, retracing roughly 38% of its prior decline. Williams %R signalled overbought conditions before reversing, and the subsequent breakdown confirmed the retracement’s significance. These cases highlight how the 38.2% level can play out in various market scenarios.
How to Use It Strategically
In an uptrend, wait for prices to pull back to the 38.2% retracement level and look for bullish confirmation signals before entering long positions. To manage risk, place stop-loss orders just below the next Fibonacci level. In a downtrend, this level can act as a resistance point for short positions, provided bearish momentum is confirmed. Combining this retracement level with other tools – like candlestick patterns, RSI, or trend line analysis – can improve trading outcomes.
This retracement level strikes a balance between shallow pullbacks (like the 23.6% level) and deeper corrections, making it a versatile component of systematic trading plans.
3. 50% Retracement Level
The 50% retracement level is a standout in technical analysis. While not part of the traditional Fibonacci sequence, it’s widely recognised and used by traders due to its consistent appearance in market behaviour patterns. This level marks the halfway point of a price movement, making it a key psychological marker for market participants.
Why the 50% Level Matters
Unlike the mathematically calculated Fibonacci ratios, the 50% retracement level is rooted in observed market behaviour. Markets often pull back by exactly half of their previous move, a phenomenon so prevalent that traders consistently factor it into their strategies. Despite its non-Fibonacci origins, the 50% level has earned its place as an essential tool in technical analysis.
How to Calculate the 50% Retracement
The calculation is straightforward: take the total price movement and multiply it by 0.5. For example, if DBS Group Holdings rises from S$28.00 to S$32.00 (a S$4.00 increase), the 50% retracement is S$4.00 × 0.5 = S$2.00. To find the key level in an uptrend, subtract this amount from the peak: S$32.00 – S$2.00 = S$30.00. This S$30.00 level becomes a critical point to watch, offering insight into market psychology and potential price action.
Market Psychology and How Traders Use It
The 50% retracement level carries significant psychological weight. When prices pull back halfway after a strong move, it often becomes a decision point. Traders who missed the initial trend view this as a second chance to enter, while those already in positions evaluate whether the trend will continue or reverse. This blend of anticipation and caution makes the 50% level a focal point in market analysis.
- In uptrends, the 50% level often acts as a support zone. Prices tend to bounce off this level, resuming their upward movement. If this support fails, however, it may signal a deeper correction, potentially heading toward the 61.8% retracement level.
- In downtrends, the 50% level serves as resistance. When prices struggle to break above this level, it often confirms the strength of the bearish trend, providing opportunities for traders to initiate or add to short positions.
Strengthening the 50% Signal with Other Indicators
While the 50% retracement level is valuable, it’s best used alongside other technical tools. Look for confirmation through candlestick reversal patterns, volume surges, or signals from momentum oscillators. Relying on the 50% level alone can sometimes lead to false signals, so combining it with additional indicators increases its reliability.
Managing Risk Around the 50% Level
Risk management is crucial when trading at the 50% retracement. For long positions near this level, place stop-loss orders slightly below the next Fibonacci level to allow for minor price fluctuations. For short positions where the 50% level acts as resistance, stops should be set just above the level, with a small buffer to account for market noise. These strategies help protect capital while aligning with broader trading plans.
The 50% retracement level’s popularity stems from its frequent validation in the markets, making it a self-reinforcing tool. Understanding its psychological and strategic importance ensures it remains a powerful component of any trader’s toolkit.
4. 61.8% Retracement Level
The 61.8% retracement level is often seen as the cornerstone of Fibonacci trading. Known as the golden ratio, this number holds deep mathematical significance that transcends markets, showing up in nature, architecture, art, and even biology. Its roots lie in the Fibonacci sequence, which has fascinated mathematicians and traders alike.
The Mathematical Foundation
The golden ratio (1.618) and its inverse (0.618) form the basis of this retracement level. These numbers are not just theoretical; they are woven into the fabric of the Fibonacci sequence, making the 61.8% level a natural fit for analysing market behaviour.
Why Traders Value the 61.8% Level
This level is widely regarded as a key zone where prices often hesitate, consolidate, or reverse. Its reliability has made it a go-to tool for traders looking to identify potential turning points in the market.
How to Calculate the 61.8% Retracement
To find the 61.8% retracement, take the total price movement and multiply it by 0.618. For example, if a stock rises from S$2.50 to S$3.50, the total movement is S$1.00. Multiplying this by 0.618 gives S$0.618. Subtracting this value from the peak (S$3.50 – S$0.618) gives approximately S$2.88 – a level that often acts as support in an uptrend.
Real Market Examples
This retracement level is especially useful in trending markets. Take Apple Inc. (AAPL) as an example. After reaching a high of around $198, the stock retraced and paused near the 61.8% level at $152.45. This zone became a robust support area, creating multiple trading opportunities.
Trading Strategies Around the 61.8% Level
- In Uptrends: The 61.8% retracement often serves as the last line of support before prices resume their upward trajectory. Traders watch for bullish signals, such as candlestick patterns or RSI rebounds, to confirm a reversal.
- In Downtrends: This level frequently acts as resistance. If prices fail to break above the 61.8% retracement during a bounce, it can solidify a bearish trend, offering opportunities for short trades.
Combining with Other Tools for Precision
To improve the reliability of the 61.8% level, traders often pair it with other indicators like trend lines, RSI, or MACD. This combination – known as confluence – helps confirm potential reversals or continuations.
Managing Risk Effectively
Risk management is crucial when trading near this level. For long positions, traders typically place stop-loss orders just below the next Fibonacci level, such as the 78.6% retracement. For short positions, stops are set slightly above the 61.8% level to account for normal price fluctuations.
With its strong mathematical foundation and proven effectiveness in various markets, the 61.8% retracement level is an essential tool for traders. Whether you’re focusing on support, resistance, or broader market trends, this level offers a reliable framework for making informed trading decisions.
Master Systematic Trading with Collin Seow
Learn proven trading strategies, improve your market timing, and achieve financial success with our expert-led courses and resources.
5. 78.6% Retracement Level
The 78.6% retracement level is the deepest pullback in the Fibonacci sequence, marking a critical juncture where traders evaluate whether the current trend will continue or reverse. This level complements the earlier retracement points, providing insight into when a trend might falter.
The Final Test of the Trend
Compared to shallower retracement levels, the 78.6% level acts as the last line of defence for a trend. When prices reach this point, it suggests significant pressure on the prevailing trend. In an uptrend, a break below this level may signal the end of the upward movement, while in a downtrend, a break above it could indicate a reversal.
The “Golden Pocket” Zone
The area between the 61.8% and 78.6% retracement levels is often called the “golden pocket” by traders. This zone is seen as a prime area for potential reversals. It represents a deep pullback that can catch emotional traders off guard, creating an opportunity for the primary trend to resume with strength.
How to Calculate the 78.6% Level
To find the 78.6% retracement level, multiply the total price movement by 0.786. For instance, if the Straits Times Index rises from 3,200 to 3,600 points (a 400-point increase), the 78.6% retracement would equal 314.4 points. Subtracting this from the peak gives approximately 3,285.6 – a level that could serve as the final support before a trend potentially changes direction.
Example: NVIDIA‘s Price Action
Take NVIDIA (NVDA) as an example. The stock climbed from US$75.61 to US$140.76. When it retraced and found support near the 78.6% level, savvy traders waited for confirmation signals – like a moving average crossover or increased trading volume – before entering long positions. To manage risk, they placed stop-loss orders slightly below the swing low.
Trading Approaches at the 78.6% Level
Trading at this level requires extra vigilance due to its proximity to trend invalidation. Traders often rely on additional signals before making decisions, such as:
- Volume spikes that suggest institutional activity,
- Reversal candlestick patterns like hammers or dojis,
- RSI divergence, hinting at momentum shifts, and
- Moving average support aligning with the Fibonacci level.
These signals help confirm whether the retracement marks a genuine reversal or just a temporary pullback.
Managing Risk at the 78.6% Level
Since this level represents the final checkpoint before a potential trend reversal, risk management is crucial. Traders typically use tighter stop-loss orders, placing them just beyond the next key level to minimise potential losses. While this retracement level offers promising reversal opportunities, it also carries higher risk, making patience and proper confirmation essential to successful trading.
Comparing Each Fibonacci Level
Knowing how Fibonacci retracement levels differ can help traders make smarter decisions about when to enter or exit trades. Each level has a unique mathematical basis, typical market behaviours, and varying reliability as a trading signal.
These levels stem from the Fibonacci sequence, with each ratio calculated from specific divisions within it. Interestingly, the 50% level isn’t based on the Fibonacci sequence but is widely used due to its psychological importance – many traders naturally view halfway points as significant. Meanwhile, the 78.6% level comes from the square root of 61.8% (√0.618 ≈ 0.786), making it useful for spotting deeper retracements.
Here’s a quick table comparing these levels by their origin, market behaviour, and reliability:
| Level | Mathematical Origin | Market Behaviour | Reliability |
|---|---|---|---|
| 23.6% | Fibonacci ratio (n/n+3) | Shallow pullback, strong trend | Low |
| 38.2% | Fibonacci ratio (n/n+2) | Moderate retracement, support/resistance | Moderate |
| 50% | Not a Fibonacci ratio | Psychological level, frequent pauses | Moderate-High |
| 61.8% | Golden ratio (n/n+1) | Strong reversals, key level | High |
| 78.6% | √0.618 | Deep retracement, last defence | Moderate |
The behaviour around these levels varies. For example, the 23.6% retracement often signals a shallow pullback during a strong trend, making it less reliable on its own. On the other hand, the 38.2% and 61.8% levels are more dependable, particularly in trending markets. The 61.8% level, known as the golden ratio, is frequently seen as the most reliable by seasoned traders.
Let’s look at an example. Imagine a Singapore stock rising from S$3.80 to S$4.89. It could retrace to the 38.2% level, around S$4.47, before continuing its upward trend. This kind of moderate retracement often provides a good entry point for traders looking to ride the trend further.
Understanding these distinctions is essential for applying Fibonacci levels effectively, especially during Singapore’s active trading hours when volumes are higher in the morning and afternoon. Having this quick reference helps traders decide which level to focus on and how to set stop-loss and take-profit levels based on market conditions.
According to Collin Seow Trading Academy, combining Fibonacci retracements with tools like moving averages or candlestick patterns can improve their effectiveness. Their resources and live webinars are tailored to help traders master these techniques, specifically in the context of Singapore’s markets.
The 61.8% level continues to be a favourite among traders, whether they’re analysing SGX stocks or forex pairs like EUR/USD.
How to Use Fibonacci Levels in Systematic Trading
Trading systematically with Fibonacci levels requires discipline and a blend of complementary technical tools. This method builds on the core principles of Fibonacci retracement, as discussed earlier, and adds layers of precision to trading decisions.
One effective approach is combining Fibonacci retracement levels with moving averages to create zones of confluence. These zones can significantly enhance trade accuracy. For instance, when Fibonacci levels align with moving average confluence and volume spikes, they highlight high-probability entry points.
Bullish Setups: Start by drawing Fibonacci retracement levels from a recent low to a high. Look for price pullbacks that align with moving average support. If the price reaches a Fibonacci level and shows signs of reversal – such as bullish candlestick patterns or holding above the moving average – it suggests a potential long entry. The signal strengthens when a short-term moving average crosses above a long-term one, indicating bullish momentum.
Bearish Setups: Draw Fibonacci levels from a recent high to a low. Watch for price rallies toward Fibonacci resistance. If this coincides with a short-term moving average crossing below a long-term one and the price breaking through a key Fibonacci level, it signals a potential short entry.
For example, after NVDA surged from US$75.61 to US$140.76, the stock retested a Fibonacci level. The trade setup was confirmed by a moving average crossover and a volume spike. A stop-loss was placed below support, and the profit target was set at the 127.2% Fibonacci extension.
Using Volume for Confirmation
Volume analysis adds another layer of reliability to Fibonacci setups. A spike in volume combined with reversal candlestick patterns at key Fibonacci levels often signals a strong reversal. On the other hand, a gradual increase in volume may indicate accumulation, which could lead to a breakout. Conversely, low volume during retests usually reflects weak conviction, signalling traders to either avoid the trade or tighten their stop-loss orders.
Risk Management and Stop-Loss Placement
Risk control is crucial when trading with Fibonacci levels. Place stop-loss orders just beyond the next Fibonacci level to limit potential losses while accounting for typical price fluctuations. In an uptrend, stops are often placed below recent lows, whereas in a downtrend, they are set above recent highs. This method helps protect capital without being overly sensitive to minor market noise.
Time Frames and Market Conditions
The effectiveness of Fibonacci levels depends significantly on the time frame. Higher time frames, such as 1-hour, 4-hour, or daily charts, tend to respect these levels more, as institutional traders and algorithms focus on them. However, avoid relying on Fibonacci strategies in sideways markets, where these levels often lose their predictive value.
Common Pitfalls to Avoid
Traders frequently make mistakes such as measuring insignificant price moves, ignoring the broader trend, or failing to wait for confirmation. For example, focusing solely on short-term pullbacks without considering the bigger picture can lead to poor decisions. While Fibonacci levels can point to potential reversal zones, they are not guarantees of market turning points.
Position Sizing and Trade Strength
Adjust your position size based on the strength of the setup. When Fibonacci levels align with multiple indicators – such as moving average confluence, volume confirmation, and bullish price action – it may justify a larger position. Conversely, weaker setups might call for smaller positions or should be skipped entirely.
As highlighted by the Collin Seow Trading Academy, integrating Fibonacci retracements with other technical tools can enhance trade precision in Singapore’s market. Their courses and live webinars focus on identifying high-probability Fibonacci setups tailored to local market conditions, helping traders develop the discipline needed for consistent execution.
Using Extensions for Profit Targets
Fibonacci extensions provide objective profit targets beyond standard retracement levels. Instead of guessing where to take profits, these extensions offer mathematically derived levels that often align with natural support or resistance areas.
Trading systematically with Fibonacci levels demands patience, proper confirmation, and adherence to strict rules. These levels are most effective in trending markets with sufficient volume and a clear directional bias.
Learning Resources from Collin Seow Trading Academy

If you’re looking to sharpen your trading skills and adopt a systematic approach, the Collin Seow Trading Academy offers a range of educational resources tailored for Singapore traders. These resources are particularly helpful for mastering technical analysis techniques like Fibonacci retracement levels, which play a key role in many trading strategies.
Free Foundation Courses
Start with the Market Timing 101 E-Course, a free resource that introduces essential market timing principles [37–39]. This course lays the groundwork for both day and swing trading techniques. Considering that successful day traders often achieve win rates of around 50–60%, having a solid market-timing strategy is essential for sustainable success.
Live Webinars for Real-Time Learning
The Systematic Trading Profits LIVE Webclass offers weekly webinars packed with market updates and actionable trading insights [37–39]. These sessions delve into the 3-Phase Growth System, showcasing how technical concepts – like Fibonacci retracements – can be combined with other indicators to navigate live markets effectively.
Comprehensive Trading Education
For those seeking a more in-depth learning experience, the Systematic Trader Program (SMT) provides a structured curriculum that teaches traders what to buy and when to buy [37,38]. By focusing on systematic strategies, the programme helps traders eliminate emotional decision-making, enabling them to succeed in both short- and long-term trading scenarios.
Collin Seow, a certified Chartered Market Technician with over 13 years of experience in Singapore’s trading scene, leads these courses. His expertise ensures that Fibonacci retracement techniques are taught as part of a broader framework, combining technical analysis with an understanding of market behaviour [37,38].
Practical Trading Tools
To complement its educational offerings, the academy provides the TradersGPS Trading System. This tool helps traders identify promising stocks based on specific criteria. With strategies for both Weekly Position and Daily Swing trading, the system allows users to apply Fibonacci analysis across different timeframes. Case studies from successful traders further highlight its effectiveness.
Key Focus Areas and Insights
Collin Seow’s trading philosophy revolves around three core principles: selecting strong stocks, timing entries precisely, and managing risks effectively. As he explains:
“Success in trading is not just about making decisions; it’s about making informed decisions”.
The academy also highlights the cautionary advice from the U.S. Securities and Exchange Commission:
“Day traders typically suffer severe financial losses in their first months of trading, and many never graduate to profit-making status”.
These insights aim to help traders avoid common pitfalls and use technical tools, like Fibonacci retracements, more effectively.
Integrated Learning for Success
The Collin Seow Trading Academy combines Fibonacci retracement techniques with technical and comparative strength analysis to create a well-rounded trading strategy. This approach ensures that traders not only understand how to draw Fibonacci levels but also know how to integrate them into a complete, systematic trading plan.
With these resources, you’ll be better equipped to navigate Singapore’s fast-paced trading environment and apply Fibonacci retracement with confidence.
Conclusion
Let’s wrap up the key takeaways from this discussion. Fibonacci levels are a powerful tool for organising your trading approach. These ratios – 23.6%, 38.2%, 50%, 61.8%, and 78.6% – serve as reliable markers for identifying support and resistance levels. They play a vital role in shaping your decisions around entry points, stop-loss placements, and profit targets.
The beauty of Fibonacci retracements lies in their flexibility. Whether you’re analysing daily charts for swing trades or hourly charts for shorter-term positions, these levels hold their ground across different timeframes. For instance, Ethereum’s retracement to the 61.8% level at S$2,362 in May 2025 is a clear example of how these principles apply in real-market scenarios.
That said, Fibonacci retracements work best as part of a broader toolkit. Pairing them with other technical indicators, such as trend analysis and volume patterns, can create a more reliable and well-rounded trading framework.
Mastering Fibonacci analysis requires consistent practice. In Singapore’s trading landscape, success often hinges on understanding these levels within the larger market context.
For those looking to refine their skills, structured courses at Collin Seow Trading Academy offer a comprehensive approach. Their curriculum blends Fibonacci techniques with strategies for market timing and risk management, helping traders build a solid foundation for long-term success.
As you incorporate these levels into your trading strategy, remember to balance risk management with ongoing technical learning. Disciplined and systematic trading is often rewarded in the markets.
FAQs
How can I use Fibonacci retracement levels with other technical indicators to enhance my trading strategy?
To improve your trading strategy, try blending Fibonacci retracement levels with tools like moving averages, trend lines, and candlestick patterns. When used together, these indicators can help confirm price movements and offer clearer entry and exit points.
For instance, Fibonacci levels can highlight important support and resistance areas, while moving averages give you a sense of the broader trend. Meanwhile, candlestick patterns can indicate potential reversals at those key levels. By combining these tools, you can gain a better understanding of market behaviour, manage risks more effectively, and make smarter trading decisions.
What mistakes do traders commonly make with Fibonacci retracement levels, and how can they avoid them?
Traders often stumble when working with Fibonacci retracement levels, especially by inconsistently picking swing highs and lows. This inconsistency can throw off the accuracy of the retracement levels, leading to unreliable trading signals. Another frequent misstep is depending entirely on Fibonacci levels without using other technical tools, which limits their usefulness.
To steer clear of these mistakes, always stick to selecting clear and significant swing points. Pair Fibonacci retracement levels with other indicators – like moving averages or candlestick patterns – to validate signals more effectively. A structured approach aligned with your trading strategy is crucial, especially in Singapore’s fast-paced trading scene, where precision and discipline make all the difference.
How can I identify the most reliable Fibonacci retracement levels for different market conditions or timeframes?
The effectiveness of Fibonacci retracement levels often hinges on factors like market conditions, the timeframe chosen, and how well they align with other trading indicators. Levels such as 38.2%, 50%, and 61.8% are commonly seen as key support or resistance zones, especially during strong trends or following significant price movements.
To improve precision, it’s a good idea to apply Fibonacci levels on longer timeframes, such as weekly or monthly charts. These broader timeframes help cut through short-term market noise, making overall trend patterns easier to spot. Using multi-timeframe analysis, where Fibonacci levels align across different time periods, can also add another layer of reliability. Pairing these levels with trend direction and volume analysis can make them even more effective in varying market scenarios.