What Is A Trendline?
A trendline is simply a momentum indicator. It measures the rate of increase in the share price over time and alerts you to any acceleration or deceleration of the trend. The difference between trendlines and other momentum indicators is that you use a super-computer (the human brain) to visually identify the trend, rather than a simplistic formula calculated on your PC.
A trend line is a straight line that connects two or more price points and then extends into the future to act as a line of support or resistance. Many of the principles applicable to support and resistance levels can be applied to trendlines as well.
How To Draw Trendlines
As a general principle:
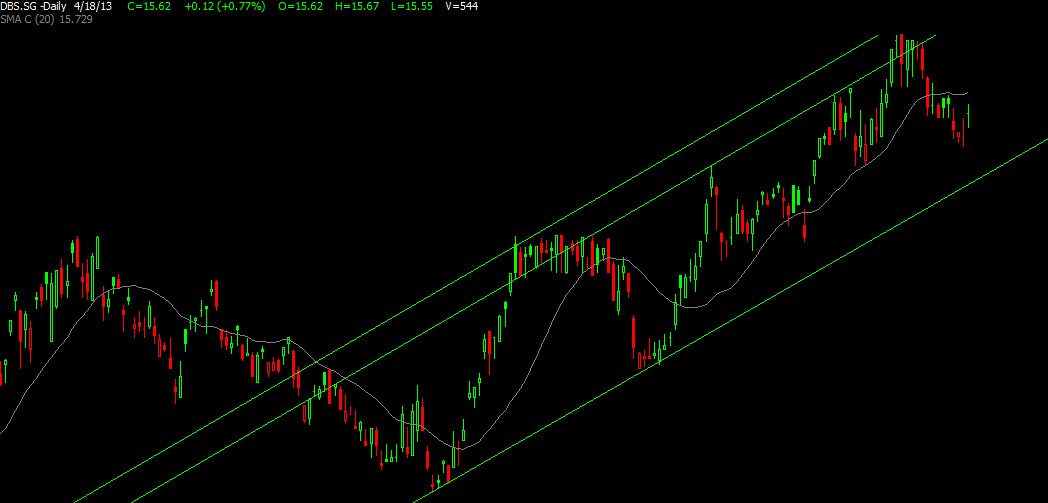
- Draw trendlines through the lows of an up-trend — and through the highs of a down-trend
- Trendlines must be respected by at least three lows (or highs in a down-trend) — if respected twice, the trendline is not yet confirmed; but can still be useful
- As the steepness of a trendline increases, the validity of the support or resistance level decreases. A steep trend line results from a sharp advance (or decline) over a brief period of time
Trend lines can offer great insight, but if used improperly, they can also produce false signals.
Other items – such as horizontal support and resistance levels or peak-and-trough analysis – should be employed to validate trend line breaks.
While trend lines have become a very popular aspect of technical analysis, they are merely one tool for establishing, analyzing, and confirming a trend.
Trend lines should not be the final arbiter, but should serve merely as a warning that a change in trend may be imminent. By using trend line breaks for warnings, investors and traders can pay closer attention to other confirming signals for a potential change in trend.
It pays to remember that drawing trendlines are more of an art than science, and it certainly takes some experience to be able to draw well-defined trendlines with absolutely no bias whatsoever.
Here are some examples of well-drawn Trendlines:-