What is a Candlestick Pattern?
A candlestick pattern is a charting technique used in technical analysis to help traders better predict future price movements based on historical market data. A candlestick chart displays the price movement of an asset over a specific period, using candle-shaped visual representations to interpret the data.
Each candlestick shows the opening, closing, high, and low price of a given period. Candlestick patterns offer traders valuable information at a glance, making it possible to identify certain chart patterns that may signal market trends and opportunities.
How Many Candlestick Patterns Are There?
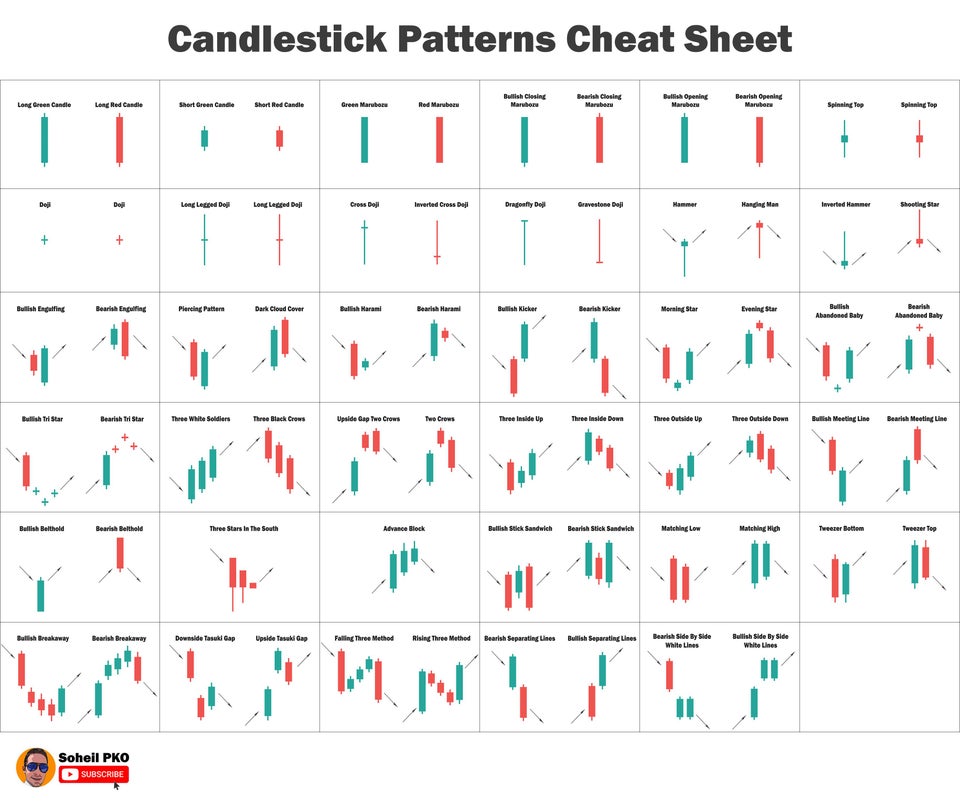
There are many candlestick patterns, but some are more commonly used and recognized than others. Here are some of the most popular:
- Doji
- Hammer
- Morning Star
- Evening Star
- Shooting Star
- Engulfing Pattern
- Harami Pattern
- Dark Cloud Cover
- Piercing Line
- Tweezer Tops and Bottoms
Many of these patterns have bullish or bearish interpretations and can signal potential future price movements.
Which Candlestick Pattern is More Reliable?
The reliability of a candlestick pattern depends on several factors, including the trading strategy being employed, the market context, and the trader’s experience with candlestick charting. While there is no universal answer, there are some general guidelines to consider.
Patterns that occur after a prolonged trend tend to be more reliable than those that form in a sideways market or during consolidation. For example, an Engulfing Pattern after a prolonged downtrend may signal a trend reversal and a potential buying opportunity.
Additionally, patterns that occur on higher time frames tend to be more reliable than those on lower time frames. For instance, a Morning Star pattern on the weekly chart may carry more significance than one on the daily or hourly chart.
Candlestick patterns are a valuable tool for traders looking to gain insights into the market’s historical price movement. While it’s essential to keep in mind that no pattern is 100% accurate, understanding and correctly reading these patterns can help traders make informed decisions and improve their trading strategies.
Candlestick Patterns For Beginners
If you had just started to trade the stock market during/shortly after the COVID-19 crash, or at similar crashes…
You might be thinking to yourself that the market has gotten somewhat more difficult to trade.
Charts which looked promising somehow went “off-track”. The volatility increases, corrections look scary and you start to wonder if you were actually ready for this ride.
Well, there are means and tools to help with that predicament. After all, if what you know now isn’t working, then it’s time to look at how to help get it back on track.
One of these commonly overlooked aspects, is candlestick patterns!
It’s one of my favourite topics because there’s a levelling up to it. In the beginning, as most of us probably do, I started off by plain memorizing these patterns.
Which wasn’t all that fun because… Who likes memory work, right?
As I looked at more and more charts and witnessed the dynamism of the market, it became clear to me that it was a matter of understanding what these price actions meant. (These price actions are reflected via the candlestick patterns.)
In the end, these “textbook” patterns that we learn will not always apply exactly in the live charts. Rather, there will be some variations, and it is up to you to be flexible about it.
Of course, if you would rather have the exact textbook patterns appear, that is perfectly fine. Do note, however, that you would have to exercise more patience in waiting for the set-up.
In my view, I would rather think that it is prudent to test out what actually works for you. This principle applies not just with candlestick patterns, but also with your trading style.
Before we dive into the various patterns, let’s first look at the basics of reading a candlestick.
Candlestick Basics
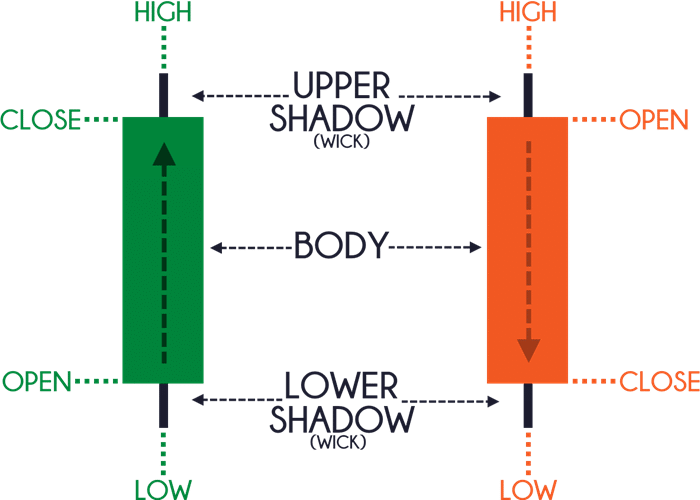
There are 4 types of price information that we can gather from 1 candlestick:
- Open
- High
- Low
- Close
We have a visual representation of this price information from the respective “wicks” (also known as “shadows”) of the candle. The top wick shows the high, the bottom wick shows the low, and the candle’s “body” shows the open and close prices.
While the high and low is clearly indicated by the top and bottom of the wicks, the body will determine the open and close.
In which case, each candle is usually represented on the chart in black and white (i.e. filled and unfilled), or with colours such as red and green. In which case:
- White/unfilled/green candle = price closed higher than the previous session.
- Black/filled/red candle = price closed lower than the previous session.
The “session” refers to the timeframe that you have selected for the chart. For instance, if it is a monthly chart, then each candlestick would reflect the open, high, low and close for 1 month. This applies for the respective charts on the weekly, daily, 4-hourly, hourly, 30-min, 15-min, 1-min, etc. Each candlestick would represent price on the respective timeframe.
By changing your timeframe, the information that is conveyed in the candlestick would reflect that accordingly.
We can largely categorize candlestick patterns into (1) bullish, (2) bearish, and (3) continuation patterns. Now that we’ve covered the candlestick basics, let’s get into some of the easier-to-digest patterns.
#1 Engulfing
Engulfing patterns are either bullish or bearish. It is made up of 2 candles in which the body of the first candle is completely “engulfed” by the second candle.

In the bullish engulfing situation, the first candle should be bearish, and it is engulfed by a bullish candle.
In the bearish engulfing situation, the first candle should be bullish, and it is engulfed by a bearish candle.
To interpret this, let’s take the bullish engulfing situation as an example. Although the second candle opens lower than the first, buying pressure increased and price eventually closed above the previous candle. This shows that the buyers are now in control, and is a bullish sign that price may head upwards.
#2 Doji
The doji resembles a cross or plus sign “+”, where the market’s open and close prices are almost the same. The body should be short or non-existent, and the wicks should be short and of about the same length for the top and bottom. It is therefore a continuation (also thought of as neutral) pattern, as it does not have any bullish or bearish indications.
This can be interpreted as a sign of indecision, as both buying and selling pressure are almost equal.
Nonetheless, the doji can be interpreted in combination with its neighbouring candles to derive bullish/bearish signals. In that context, the doji can be taken as a reversal pattern as well, as in the case of the (bullish) morning star and (bearish) evening star patterns.
In addition, slight variations to the cross-like doji will result in other patterns, which we will talk about next.
:max_bytes(150000):strip_icc():format(webp)/DojiDefinition2-1356bb5eca0d47b5a086d2589b9a306e.png)
#2.1 Dragonfly Doji & Gravestone Doji
The dragonfly doji appears like a “T” shape. The open, close and high prices are almost the same. The lower wick should also be long, and this overall represents a rejection of lower prices as the session not only opened, but maintained its close at the top.
The gravestone doji, on the other hand, appears like an “inverse T”. The open, close, and low prices are almost the same. The upper wick should be long, and this represents a rejection of higher prices. Despite buying activities, price eventually closed near or at the open, at the low of the candle.
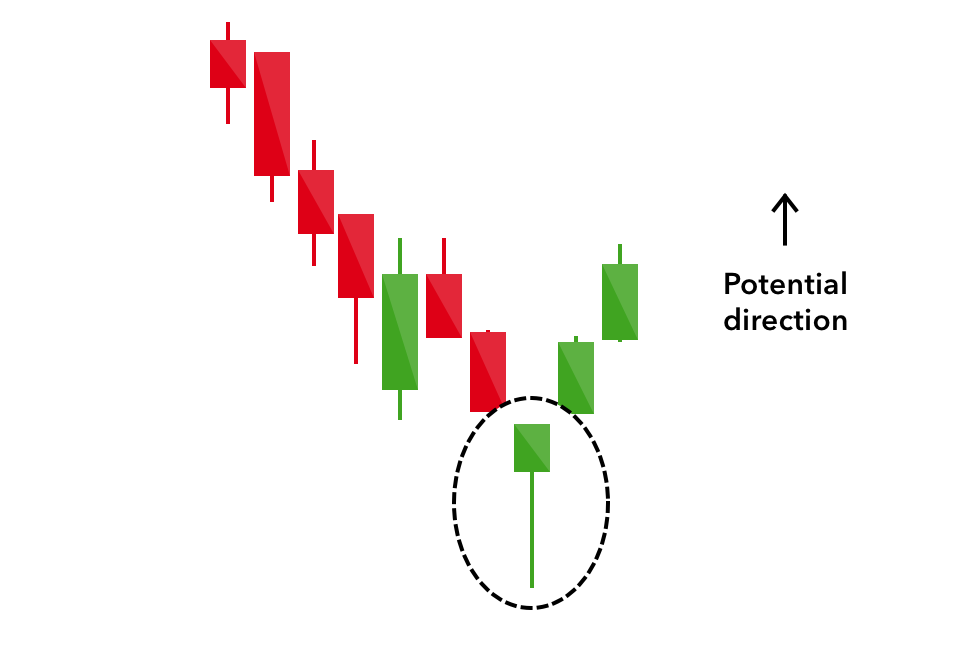
#3 Hammer
The hammer candlestick is similar to the dragonfly doji where the close and high prices are the same, or almost the same such that there is little to no upper wick. There is a long lower wick as well. However, there are 2 main differences:
- The opening price, despite the selling pressure, eventually closed higher, thereby giving the candle a short body.
- Where the hammer is found at the bottom of a downtrend, it is a bullish reversal pattern. Prices are likely to head upwards as buyers took control and closed prices higher after the selling climax.
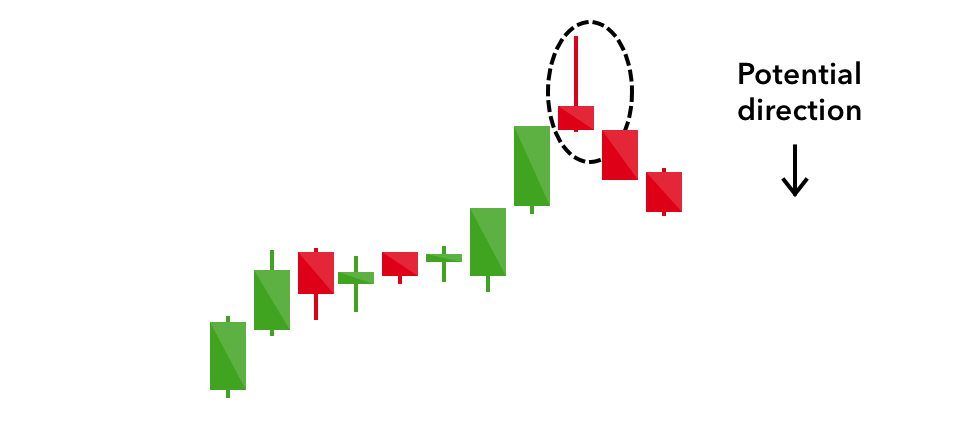
#4 Shooting Star
Its bearish counterpart will be the “shooting star”. Again, you may take reference from the gravestone doji, or simply note the following differences:
- The opening price, despite the buying pressure, eventually closed lower, thereby giving the candle a short body.
- Where the shooting star is found at the top of an uptrend, it is a bearish reversal pattern. Prices are likely to head downwards as sellers took control and closed prices lower after the buying climax.
While there is another candlestick pattern known as the “inverse hammer”, the main difference with the shooting star is that the former is formed in a downtrend, whereas the latter is in an uptrend. In this case, the inverse hammer is actually a bullish pattern. This because sellers were unable to drive prices lower, and price eventually closed higher.
I hope you’re not confused by all these names at this point and seeing stars already. If you’re feeling all good, let’s carry on with the last 2 patterns (more stars)!
#5 Morning Star
Remember that earlier on, I mentioned that the doji could be interpreted in combination with its neighbouring candles?
Well, that’s what the morning star and evening star encompass. They are both 3-candle patterns. The doji in the middle should not be overlapping between the 2 candles as price gaps on both the open and close prices.
So, here are the differences between the bullish morning star and bearish evening star.
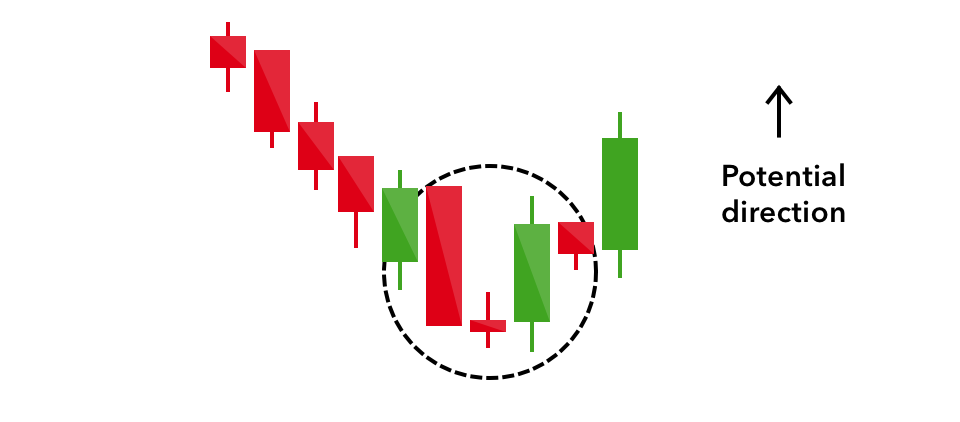
The morning star is a bullish candlestick pattern which appears after a decline in prices. The first candle is a down candle, followed by the doji which shows indecision in the markets. When the third candle being an upward candle with a long body appears, this indicates that selling pressure is subsiding.
#6 Evening Star
On the other hand, the evening star is a bearish candlestick pattern which appears after price advances. The first candle is an up candle, followed by the doji which again shows indecision. Buying and selling are at an equilibrium. When the third candle which is a downward candle with a long body appears, this indicates that buying pressure is subsiding. The bears have won this time, and prices are likely to decline.

#7 Harami Pattern – The Little One with a Big Impact

The Harami Pattern is a powerful tool used by traders to identify potential trend reversals in the market. This pattern is characterized by two candlesticks, where the first one is larger and the second is smaller, indicating a possible reversal in momentum. This small candlestick is often referred to as the ‘harami’ or ‘pregnant’ candle, as it appears to be enveloped by the previous larger one.
If the harami pattern occurs after a downtrend, it may signal a possible bullish reversal. Conversely, if it occurs after an uptrend, it may signal a bearish reversal. The harami pattern is widely regarded as one of the most reliable candlestick patterns, with the potential to predict trend changes with high accuracy.
#8 Dark Cloud Cover – A Sign of the Storm Ahead

The Dark Cloud Cover is a bearish reversal pattern that indicates a possible trend reversal in the market. This pattern is characterized by two candlesticks, where the first one is bullish, and the second is bearish. The second candlestick opens above the first one’s high but then closes below the first one’s midpoint, indicating a weaker bullish momentum and a potential change in trend direction.
Traders often use this pattern as an early warning sign to avoid buying or enter short positions. The Dark Cloud Cover can be beneficial in the context of an overbought market, helping traders avoid making poor purchasing decisions.
#9 Piercing Line – Breaking Through Barriers

The Piercing Line pattern is a bullish reversal pattern that occurs after a downtrend and suggests a possible trend reversal. This pattern is characterized by two candlesticks, where the first one is bearish, and the second one is bullish. The second candlestick opens below the previous one’s low but then closes above the midpoint of the previous one, indicating a potential shift in market sentiment.
Traders often see this pattern as a sign of strength and potential buying opportunities. However, it’s not a foolproof indicator of an uptrend, and traders need to consider the broader market context before making any investment decisions.
#10 Tweezer Tops and Bottoms – The Battle Between Bulls and Bears

The Tweezer Tops and Bottoms pattern is a reversal pattern that typically indicates the end of a trend. This pattern is characterized by two or more candlesticks with identical highs (Tweezer Tops) or lows (Tweezer Bottoms), indicating a battle between the bulls and bears.
The Tweezer Top pattern typically occurs at the end of an uptrend and signals a potential reversal to a downtrend. Conversely, the Tweezer Bottom pattern may occur at the end of a downtrend, signaling a potential reversal to an uptrend.
Traders often use these patterns in combination with other technical analysis tools to confirm potential trend reversals or identify key price levels to act as support or resistance.
Conclusion: Trading Candlestick Patterns
Do note that candlestick patterns should NOT be used in isolation.
Instead, trade them together with technical indicators such as the moving average, and perhaps even in areas of support and resistance. It’s about stacking the odds in your favour, not recklessly entering based on a single piece of knowledge.
While there is a myriad of patterns (and their corresponding names), I hope you can see that it’s about understanding what the candles mean. How market psychology is reflected in these open, high, low and close prices, and what this means in consideration of the price trend.
If you’re now thinking to yourself: Which patterns are the most powerful or accurate?
Well, feel free to head over to this Investopedia article. While it makes for good reference, remember that there are no guarantees in the markets.
Understand it, test it out for yourself, and keep the strategies that work best for you.
Read our beginner guides on stock trading and technical analysis so you can form the strategies yourself!
Ultimate Guide On Stock Trading For Beginners
The Ultimate Technical Analysis Beginner’s Guide
Can anybody start trading and investing on their own? If you’ve read up to this point, the answer is a resounding yes. Stay tuned to the next parts of the series as we adopt a systematic approach in generating a step-by-step beginner’s guide.
If you’d like to learn more about systematic trading to better time your trade entries, click the banner below:


One Response
Interested in the course