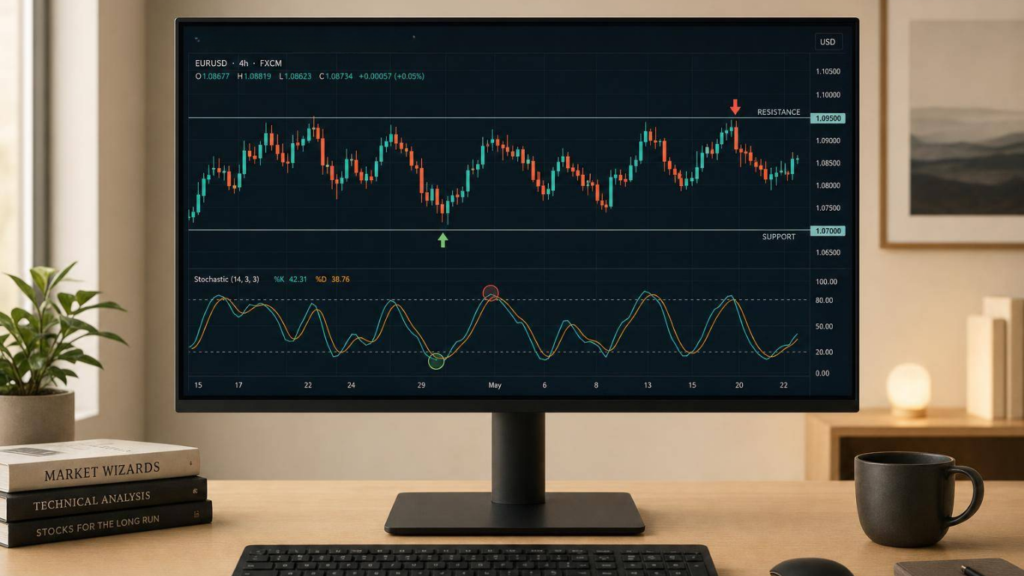
If I use stochastic in a sideways market, I only want three things: a clear range, a signal near the edge of that range, and a stop based on price structure. That’s the whole idea.
Here’s the short version: stochastic works best when price is moving between support and resistance, not when a stock is trending hard. I look for 80/20 readings as alerts, then wait for a %K/%D cross near support or resistance, and only take the trade if the stop still fits my risk cap, such as 1% of a S$10,000 account = S$100.
What I’d keep in mind:
- Check the market type first. If price is trending, stochastic can stay above 80 or below 20 for too long.
- Mark support and resistance before the indicator. Price comes first.
- Ignore mid-range crosses. Signals around 40 to 60 are often noise.
- Use candlestick patterns for backup. A hammer near support or a shooting star near resistance can help.
- Place stops beyond the swing point. Then size the trade from your S$ risk, not from a random share count.
- Skip trades with stops above about 2% to 2.5%. If risk is too far from entry, I pass.
A quick example: if an SGX stock is boxed between S$1.50 and S$1.80, a stochastic dip below 20 near S$1.50 may point to a long. But I still want the %K line to cross above %D, plus some sign that buyers are stepping in.
My takeaway: stochastic is not the reason to trade. It’s just the timing tool. The range, the level, and the stop do most of the work.
Master Systematic Trading with Collin Seow
Learn proven trading strategies, improve your market timing, and achieve financial success with our expert-led courses and resources.
sbb-itb-466c9b0
How to Identify a Valid Range and Read Overbought or Oversold Zones
Start by looking for two to three swing highs that cluster around a similar price area, and two to three swing lows that form a clear floor on the same timeframe you plan to trade. Another useful check: your moving averages should be mostly flat, without a strong slope in either direction. In plain terms, the cleaner the sideways range, the better stochastic tends to perform.
Mark support and resistance before reading the oscillator
Draw your horizontal levels first, before you look at stochastic. That order matters.
Mark the zones where price has turned sharply at least twice. Those areas become your support and resistance. Treat them as zones, not exact ticks. So if a local blue-chip stock has been moving between SGD 5.20 and SGD 5.60 over the past few weeks, those two areas become your main reference points.
After you’ve marked those levels, only pay attention to stochastic when price is near one of those edges. Signals that appear in the middle of the range are usually weak and often best left alone. They don’t have much structure behind them, and they’re more likely to get chopped up by whipsaws. This keeps the oscillator tied to price instead of using indicators in trading on their own.
Use 80 and 20 as your default alert zones
The stochastic oscillator has two lines:
- %K: the faster line, showing where the current close sits within the last 14 bars’ high-low range
- %D: a 3-period moving average of %K, used as the smoother signal line
The standard 14,3,3 setting is the most widely used because it gives a good balance between responsiveness and noise reduction.
When stochastic moves above 80, price is trading near the top of its recent range, and upside momentum may be stretched. When it falls below 20, price is near the bottom of its recent range, and downside momentum may be stretched.
That said, these are alert zones, not instant trade signals. If stochastic pushes above 80 near resistance, that’s your cue to pay closer attention. It does not mean you should sell on the spot. You still want price confirmation, such as a rejection candle or a %K cross back below %D, before taking action.
Use 80/20 as your default. Only change those levels after forward-testing.
Once the range and alert zones are set, you can use %K/%D crosses near support or resistance to help time the entry.
How to Use %K and %D Crosses to Time Your Entry
Use the %K/%D cross only at the edge of a range. That’s the sweet spot. It tends to work best when price is already sitting at support or resistance, and the oscillator is in an extreme zone. Once you’ve mapped the range, the cross helps you time the entry.
How to set up a bullish entry near support
For a long setup, you want price to move into support first. Then check the stochastic. %K should be below 20, and it’s even better if %D is also in oversold territory. That usually tells you selling pressure may be running out of steam.
The entry trigger comes when %K crosses above %D while both lines are still below 20, or just as they start to turn up. That gives you the timing piece.
Then look at the candle itself. A bullish rejection candle adds weight to the setup. This can be:
- a hammer
- a bullish pin bar
- a candle with a long lower tail that closes well off its lows
You can enter at the close of that rejection candle, or wait for the next candle to close higher if you want a bit more confirmation.
How to set up a bearish entry near resistance
The bearish setup is the same idea, just flipped.
Let price push into resistance. Then check whether %K has moved above 80, with %D also high. That points to buying pressure losing steam.
The signal appears when %K crosses below %D while still above 80, or as both lines start to roll over. In plain English: momentum is weakening right where price is hitting resistance.
Next, look for bearish rejection on the chart. Good examples include a shooting star, a bearish engulfing candle, or a bar with a long upper wick that closes near its lows.
You can enter on the rejection candle’s close, or wait for the next candle to close lower.
Stochastic-only signals vs signals with price-level confluence
A stochastic cross by itself can be messy. If it shows up far from support or resistance – especially in the middle area around 40–60 – it’s often just noise.
One systematic test found that basic %K crosses above 80 or below 20 had win rates of around 45–50% in ranges, but results got better when the cross happened at tested support or resistance with ADX below 20. That’s the key distinction: the cross handles timing, while support or resistance gives the setup its context.
| Entry trigger | Risk of false signal | Stop location | Best use |
|---|---|---|---|
| Stochastic cross only (no level) | High – especially in choppy conditions | Close to the rejection candle high/low; no structural anchor | Best for very short-lived ranges, but unreliable without a level |
| Stochastic cross + support/resistance | Lower – oscillator and chart structure agree | Just beyond the recent swing high or low | Preferred for SGX blue-chip stocks and swing trades |
| Stochastic cross + level + rejection candle | Lowest – three conditions align | Structural stop beyond the swing, with a small ATR buffer | Preferred for SGX blue-chip stocks and swing trades on daily or 4-hour charts |
For SGX equities, entries with confluence should be your default. Once the trade triggers, set the stop based on the swing structure. After entry, use the swing high or swing low to define your risk.
How to Place Stops and Manage Risk Inside the Range
After your entry trigger appears, place the stop at the point where the setup no longer makes sense. Once %K/%D gives the trigger, the stop decides whether the trade still has space to play out. A structural stop stays tied to the price level that breaks the setup. A fixed-distance stop does not account for market structure or normal day-to-day noise.
Place structural stops beyond the recent swing
For a long trade at support, put the stop just below the most recent swing low. If price breaks cleanly below that level, the trade idea is wrong. For a short trade at resistance, get out if price pushes above the recent swing high.
Position sizing starts with your SGD risk limit, not with how many shares you feel like buying, often involving fixed ratio and fixed fractional sizing methods. Work backwards from the most you are willing to lose on the trade. If your account is S$10,000 and you risk 1% per trade, your max loss is S$100. If you enter at S$5.00 and your stop is at S$4.80, your risk per share is S$0.20. That gives you a position size of about 500 shares.
That’s the key idea: use price structure to place the stop, then use your SGD risk budget to size the trade.
Match your stop method to the range width
A tight SGX blue-chip range does not move like a wide, messy range on a more volatile counter. That’s why your stop method should match the width of the range and the amount of noise inside it.
| Stop method | Definition | Pros | Cons | Best suited market conditions |
|---|---|---|---|---|
| Swing-low / swing-high stop | Stop beyond the recent swing low/high | Tied to structural invalidation; simple to use | Can be too tight in noisy markets; may get clipped by small stop runs | Clean, well-defined ranges with moderate volatility and clear swing points |
| Signal-bar stop | Stop beyond the signal candle high/low | Very tight risk per share; fast exit if the signal fails at once | Sensitive to short-term noise; can lead to many small losses in choppy conditions | Tight, smooth ranges |
| Wider structural stop | Stop beyond a broader structural level | Gives price more room; less likely to get hit by intraday spikes or stop hunts | Bigger stop distance means more risk per share; needs a smaller position size | Wide or volatile ranges, instruments with larger ATR, or higher timeframe trades |
If the 14-day ATR is small compared with the full range width, a swing-based stop or signal-bar stop will often do the job. This relationship is a core part of predicting volatility when setting up trading systems. If ATR is large compared with the range, a wider structural stop is usually safer. Just cut your share count so your total SGD risk stays inside your limit.
One more filter matters here: skip the trade if the structural stop is more than about 2% to 2.5% away from your entry. At that point, the risk is often too wide for the setup.
Use these rules to screen each setup before moving to the checklist.
A Simple Stochastic Range-Entry Checklist and Summary
Use this checklist only after price reaches your marked support or resistance. If one step doesn’t line up, skip the trade. Simple.
A 5-step checklist for profitable trading strategies in a range
- Confirm price is ranging, not trending. Look for repeated turns at support and resistance, flat moving averages, or ADX below 20.
- Mark swing highs and lows that have reversed twice. These are the levels that matter.
- Use the 14-period stochastic. Treat readings above 80 near resistance and below 20 near support as alerts only, not entry signals.
- Enter on a %K/%D cross at your marked level. Go bullish when %K crosses above %D near support, and bearish when %K crosses below %D near resistance.
- Enter on the signal candle close, place the stop beyond the invalidation swing, and size the trade to your SGD risk limit.
Key points to remember
- Stochastic works best in sideways markets. In trending conditions, it throws out a lot of false signals.
- 80 and 20 are alerts, not entries. The trigger is the %K/%D cross at a structural level. A cross in the middle of the range is usually just noise.
- Use structure-based stops and skip poor setups. If the stop distance is too large for your SGD risk limit, let the trade go.
FAQs
How do I know if a market is truly range-bound?
Use a regime dashboard to track the main signals. A market is usually range-bound when ADX is below 20 and the Hurst exponent is under 0.45.
You can also look for price circling a steady mean, such as staying within 1.5 times the ATR of the moving average, along with tighter Bollinger Bands. To cut down on false calls, wait for at least three signals to line up.
Should I wait for candle confirmation after a stochastic cross?
Yes. Waiting for candle confirmation can help filter false signals and improve entry quality.
Instead of jumping in the moment the stochastic cross appears, wait for the current candle to close. That gives you a cleaner read on whether the signal is holding up or fading by the end of the bar.
For added confidence in a range-bound market, make sure the close backs up the cross and that price is still respecting support or resistance. That extra pause can save you from taking trades that look good mid-candle but fall apart once the candle closes.
What if the stop is too wide for my risk limit?
If your stop-loss is too wide for your risk limit, cut your position size instead of dragging the stop-loss closer to the entry price.
Why? Because moving the stop just to fit your budget can knock you out of the trade too early.
For example, say you’re willing to risk SGD 500 on one trade and your stop-loss is SGD 1.50 per share. In that case, your position size should be about 333 shares to keep your maximum loss within budget.