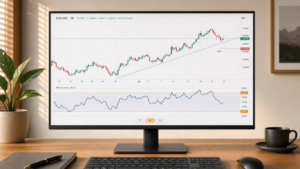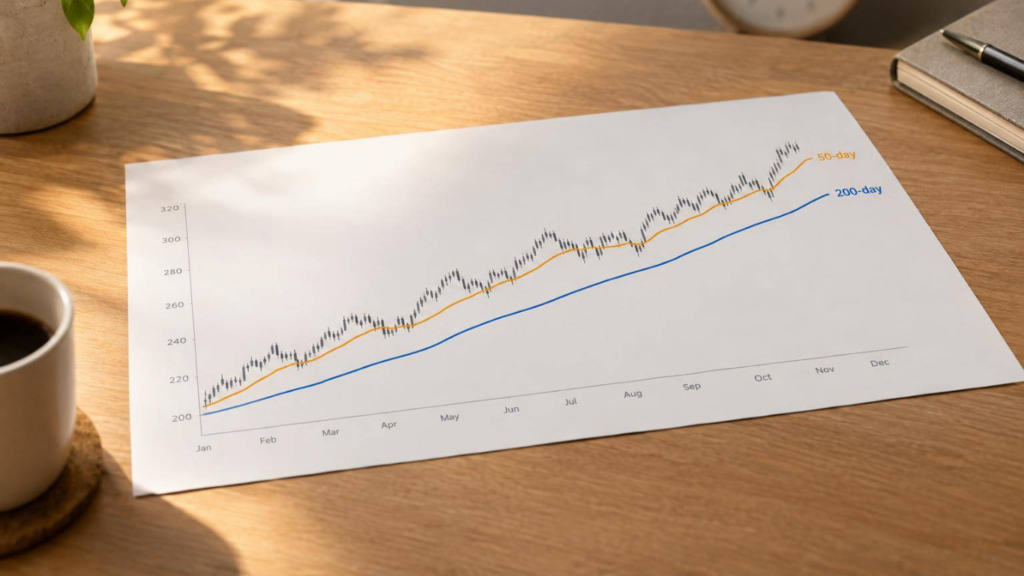
I use systematic trading with the 50-day moving average for swing-trade direction and the 200-day moving average for longer-term trends. Both average closing prices across trading sessions, not calendar days. Before acting, I check the trend signals such as the line’s slope, price swings, and volume, rather than relying on a cross alone.
Quick Comparison
| What I compare | 50-day MA | 200-day MA |
|---|---|---|
| Lookback | 50 sessions; roughly 2–3 months | 200 sessions; roughly 10 months |
| Trend focus | Intermediate-term | Long-term |
| Response | Faster, with less lag | Slower, with more lag |
| Noise | More false reversals | Less noise, but still prone to false reversals |
| Trading role | Swing-trade direction and pullbacks | Position-trade trend filtering |
Used together, the averages add context. A golden cross occurs when the 50-day moves above the 200-day; a death cross is the reverse. I treat both as possible trend shifts, not forecasts, and check them after the daily close.
For SGX shares, I also check liquidity, spreads, results dates and corporate actions. I test rules with trading costs included, avoid testing only today’s STI constituents, and set my exit and maximum loss in S$ before entering.
Neither average guarantees profits or limits losses. My holding period guides the choice; my risk rules govern the trade.
sbb-itb-466c9b0
The 50-Day MA: Tracking Intermediate-Term Trends
The 50-day SMA follows recent closing prices more closely than the 200-day SMA, so it responds faster to intermediate-term trend changes. A rising 50-day line, alongside higher highs and higher lows, supports an intermediate-term uptrend. A falling line with lower highs and lower lows points to weakness.
During a pullback, check whether the 50-day line is still rising and whether swing lows hold. Treat the 50-day MA as a moving support or resistance zone – not a hard line. A recovery with stronger volume, or a break above a recent swing high, provides more evidence than price simply touching the MA.
Earlier Signals and More Whipsaws
When price repeatedly crosses a flat MA, it often points to a trading range rather than a new trend. Read the slope, multiple closing prices and recent swing highs and lows together. One close above or below the MA does not reliably confirm a trend.
A fixed confirmation rule can reduce false signals, but the trade-off is later entries. This matters most for swing trades, where entries and exits depend on the daily close.
Using the 50-Day MA for Singapore Swing Trades
On a daily chart, the 50-day SMA’s faster response can help you assess intermediate-term direction and spot pullbacks within an established trend. Depending on your setup and exit rules, you may hold a trade for several days or a few weeks. Use the daily close, not an intraday cross.
Before placing an order, check turnover, bid–ask spreads, results dates and corporate actions. Compare the share’s direction with the Straits Times Index or its sector. Also check whether historical prices are adjusted for corporate actions.
Set an invalidation level based on nearby price structure and volatility, rather than placing it automatically at the MA. Size your position in S$ and allow room for slippage.
For longer holding periods, compare the 50-day MA with the 200-day MA, which filters out more noise but responds more slowly.
Master Systematic Trading with Collin Seow
Learn proven trading strategies, improve your market timing, and achieve financial success with our expert-led courses and resources.
The 200-Day MA: Filtering Long-Term Trends
The 200-day SMA averages the latest 200 closing prices – about 10 months of trading days. It moves more slowly than the 50-day MA, filtering out more noise to smooth short-term swings and show the longer-term trend.
Read the slope over several weeks alongside the price. Sustained closes above a rising average suggest long-term strength. Closes below a falling average suggest weakness, while a flat line gives less guidance on direction. The MA can also act as longer-term support or resistance, but a price touching it does not guarantee that the level will hold. It’s a cleaner, though slower, companion to the 50-day MA.
Less Noise but More Lag
The longer lookback filters out brief shocks, but it also takes longer to reflect reversals. The 200-day SMA may keep rising after the price starts falling. Waiting for both a price cross and a change in slope means later entries and exits.
Fewer signals don’t guarantee better accuracy or returns. In a sideways market, repeated crosses can still cause whipsaws. Test the full trading rules in both trending and consolidating periods, with transaction costs included, rather than judging the approach by a single trade.
Using the 200-Day MA for Singapore Position Trades
For SGX-listed shares you plan to hold for months, look for a rising 200-day SMA with sustained closes above it. Use the 50-day SMA to spot earlier changes in intermediate-term momentum. A sustained break below that line can prompt a review before the 200-day line turns down.
When backtesting STI stock picks, don’t use only today’s constituents: doing so can introduce survivorship bias. Set your holding period using your strategy and exit rules, not the length of the MA.
50-Day vs 200-Day MA: Main Differences
The 50-day MA tracks intermediate-term trends, while the 200-day MA gives you a longer-term view. Choose the one that fits how long you plan to hold a trade.
| Feature | 50-day MA | 200-day MA |
|---|---|---|
| Calculation window | 50 trading days | 200 trading days |
| Trend horizon | Intermediate-term | Long-term |
| Speed and lag | Faster; less lag | Slower; more lag |
| Noise sensitivity | Higher | Lower |
| Common use | Swing-trade trend assessment | Position-trade trend filtering |
| Main strength | Earlier signs of changes | Smoother view of the broader trend |
| Main weakness | More sensitive to whipsaws | Slower to recognise changes |
Read the MA’s slope alongside price structure. Rising averages paired with higher highs and higher lows support an uptrend. Falling averages paired with lower highs and lower lows support a downtrend. Flat averages with repeated price crossings point to consolidation.
When you use both averages, their crossovers can signal possible trend shifts.
Golden Cross vs Death Cross
| Signal | Condition | Meaning | Limitation |
|---|---|---|---|
| Golden cross | 50-day MA crosses above 200-day MA | Possible bullish long-term trend shift | Lags price moves; may reverse |
| Death cross | 50-day MA crosses below 200-day MA | Possible bearish long-term trend shift | Lags price moves; may reverse |
Use completed daily closes to confirm a crossover. Treat it as confirmation of a possible trend shift – not a forecast.
In Singapore markets, your choice of MA depends on whether you trade swings or hold positions for months.
Choosing MAs for Swing and Position Trades
| Trading approach | Primary MA role | Supporting MA role | Main caution |
|---|---|---|---|
| Swing trading | 50-day MA for intermediate-term direction and pullbacks | 200-day MA for broader trend context | Faster signals can whipsaw |
| Position trading | 200-day MA for long-term trend filtering | 50-day MA for pullbacks and earlier signs of changes | Long-term signals can arrive late |
Use alignment between the averages to judge trend quality. Alignment alone is not an entry signal.
Setting Entry, Exit and Risk Rules
Set your entry, exit and position size before you trade. Use the MA as a trend filter, not as a complete risk plan.
Conclusion: Match the MA to Your Trading Horizon
Compare speed, lag and signal quality, then match the MA to your holding period. The faster 50-day MA suits swing setups. The smoother, slower 200-day MA suits longer position trades. Using both gives you context – not certainty.
Before trading, test your MA rules on Singapore data. Account for brokerage costs, SGX liquidity, bid–ask spreads and realistic fills. Set your maximum loss in S$ and allow for price gaps beyond your stop.
For more on systematic trading, browse courses at Collin Seow Trading Academy. No MA signal guarantees profits or prevents losses.
FAQs
What if the 50-day and 200-day MAs disagree?
Treat disagreement as a sign of trend weakness or consolidation. Dual-MA signals become less reliable: lag can delay entries, while crossovers can produce false signals in choppy markets.
For Singapore markets, use the 200-day MA as your main trend filter and trade only in its direction. If disagreement persists, stay out until the lower-timeframe trend no longer opposes the dominant higher-timeframe trend.
How many daily closes should confirm an MA signal?
Wait for a candle to close beyond the moving average before acting. Wicks alone can give false breakout signals. For a bullish crossover entry, wait for the candle to close above the moving averages.
To curb FOMO and help check the signal, you can also require the price to close within your planned entry zone for at least one bar on your chosen timeframe.
How do SGX corporate actions affect MA signals?
SGX corporate actions, such as dividend announcements or earnings releases, can trigger price gaps or volatility that throw off moving average signals. Overnight price moves may jump past stop-loss levels or produce false crossovers.
Watch for volume surges where moving averages converge to help separate institutional activity from event-driven noise. Before acting, check higher timeframes to confirm that the signals match the broader trend.