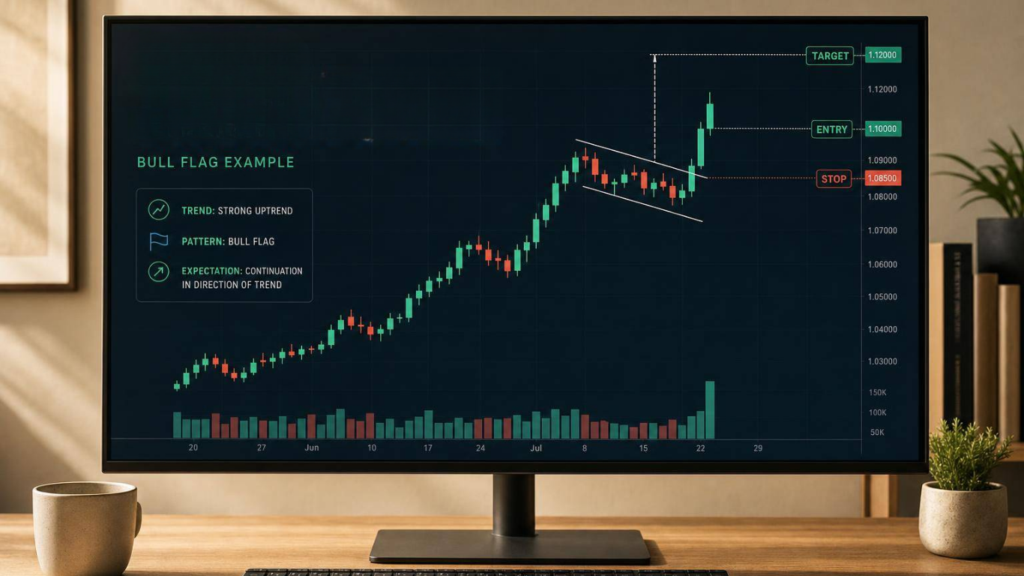
Most candlestick continuation setups fail for one simple reason: traders enter before the close. If I had to reduce this topic to one rule, it would be this: I only treat a continuation pattern as valid when price is already trending, then closes beyond the pattern boundary with volume backing the move.
Here’s the short version of the whole article:
- Continuation patterns show a pause, not a trend change.
- They only matter when there is a clear uptrend or downtrend first.
- The main setups are flags, pennants, triangles, rectangles, and candle patterns like Falling Three Methods.
- I look for 3 checks before entry: trend, close beyond the level, and above-average volume.
- I plan the trade in advance: entry, stop, target.
- A common target is the measured move: pattern height projected from the breakout point.
- I stay out when the move comes on low volume, in a sideways market, or straight into nearby support or resistance.
A simple way to think about it: impulse, pause, breakout. That’s the rhythm behind most continuation trades.
| Pattern type | What I look for | Entry trigger | Main risk |
|---|---|---|---|
| Flag / Pennant | Short pause after a strong move | Close beyond the boundary with volume | False breakout |
| Triangle | Tightening range inside trend | Close beyond trendline with volume | Breakout fails and snaps back |
| Rectangle | Sideways box in trend | Close above resistance or below support | Range continues |
| Falling Three Methods / bearish continuation | Small pause inside a downtrend | Close below support with volume | Price reclaims the level |
In practice, this is less about pattern names and more about context and discipline. If you wait for the close, check volume, and place your stop where the idea is invalid, you cut out a lot of weak trades before they cost you money.
sbb-itb-466c9b0
Core Continuation Patterns Every Stock Trader Should Know
Once you’ve got your confirmation rules sorted, the next step is knowing the continuation candlestick setups traders run into most often.
These patterns show a pause inside an existing trend. That’s the main idea. On the chart, what matters isn’t just the shape. What matters is whether price breaks out in the direction of the trend, closes beyond the pattern boundary, and does so with supporting volume.
The breakout candle is your trigger. Wait for a close beyond the boundary, then check whether volume backs it up.
Flags, Pennants, Triangles, and Rectangles
All four follow the same rhythm: impulse, pause, breakout.
A flag is a short pause after a strong move, with price trading between parallel support and resistance lines. A pennant works in much the same way, except the range tightens with converging trendlines, so it looks like a small symmetrical triangle. Triangles can be ascending, descending, or symmetrical. They show a temporary pause before the trend continues. Rectangles appear when price moves sideways between clear horizontal support and resistance, until one side finally gives way.
Ascending triangles often break in the direction of the trend. Even so, you still want confirmation from a candle close beyond the boundary with volume.
| Structure | Interpretation | Breakout Trigger | Stop Reference | Target Method |
|---|---|---|---|---|
| Flag | Brief pause in a strong trend | Close beyond the parallel boundary | Just outside the pattern boundary | Measure the pattern height and project it from the breakout point |
| Pennant | Brief pause in a strong trend | Close beyond the converging boundary | Just outside the pattern boundary | Measure the pattern height and project it from the breakout point |
| Triangle | Temporary consolidation before the trend resumes | Close beyond the trendline, ideally with volume | Just outside the pattern boundary | Measure the pattern height and project it from the breakout point |
| Rectangle | Sideways consolidation before the trend resumes | Close above resistance or below support | Just outside the range | Measure the rectangle height and project it from the breakout point |
Once the structure is clear, the trade plan comes down to three things: entry, stop placement, and target selection.
How to Trade Continuation Patterns Step by Step
Once the pattern is confirmed, the trade plan gets much simpler: entry, risk, and target.
Entry Rules for Breakout and Retest Setups
Mark the trend, the pattern boundaries, and the breakout level before price gets there. That way, you’re not making decisions on the fly.
Enter only when a candle closes beyond the boundary and the move is backed by higher-than-recent volume.
If you miss the breakout, don’t chase it. Wait for a clean retest of the broken level, then enter on the next bullish candle. That said, some breakouts don’t come back for a retest, so those moves can leave you behind.
Stop-Loss Placement and Position Sizing
Put the stop where the breakout idea is proven wrong.
For a bullish breakout, that usually means just below the broken resistance, which should now act as support. If you’re entering on a retest, place the stop just below the retest low.
Before entering, decide how much you’re prepared to lose if the stop gets hit. Then size the position so that loss stays inside your preset risk.
Master Systematic Trading with Collin Seow
Learn proven trading strategies, improve your market timing, and achieve financial success with our expert-led courses and resources.
Profit Targets and Trade Management
Use the measured move as the default target. In plain terms, take the height of the pattern and project it from the breakout level.
This gives you the same planning framework for every continuation trade, which helps keep your process steady.
| Trade Component | Best Use | Limitation |
|---|---|---|
| Entry | Candle close beyond the boundary with above-average volume | Retest entries may miss fast-moving breakouts |
| Stop | Just outside the pattern boundary or below the retest low | Wider patterns require larger stops |
| Target | Measured move projected from the breakout level | The next move may not equal the prior move |
Next, these rules will be shown on bullish, bearish, breakout, and failed-signal charts.
Chart Walkthroughs and Confirmation Checklist
Bullish and Bearish Chart Walkthroughs
Use the same framework for both a bullish flag and a bearish Falling Three Methods setup. The direction changes, but the process stays the same.
Bullish example – Flag breakout: A stock is trending higher on the weekly chart, then pauses and forms a tight flag on the daily chart. Your focus is the upper boundary of that flag. When price closes above that level on above-average volume, the breakout is confirmed. The entry comes on that confirmed close. Place the stop just outside the invalidation level, then set the target with a measured move.
The bearish version works the same way, just flipped.
Bearish example – Falling Three Methods: A stock is trending lower and forms a Falling Three Methods pattern during that decline. When price closes below pattern support on above-average volume, the breakdown is confirmed. The entry comes on the confirmed close. Place the stop just outside the invalidation level, and use a measured move for the target.
Breakout and Failed-Signal Walkthroughs
Failed signal: Sometimes price pokes through the boundary during the day but does not close beyond it. In other cases, it does close beyond the level, but volume is weak and the move runs out of steam fast. Those are warning signs.
That’s exactly why the stop sits just outside the pattern. If the setup is no longer valid, the stop gets you out before a small mistake turns into a bigger hit.
Continuation Pattern Checklist
Use this before every trade. Keep the process systematic and consistent by reviewing stock picks that align with these rules.
| Checkpoint | What to Confirm |
|---|---|
| Weekly trend aligned | Clear uptrend or downtrend on the weekly chart |
| Clean consolidation | Pattern structure is well-defined |
| Close beyond boundary | Candle closes beyond the level, not just wicks through |
| Moves with trend | Breakout direction matches the primary trend |
| Above-average volume | Breakout candle volume exceeds recent average |
| Stop outside invalidation | Stop placed just outside the pattern boundary |
| Favourable reward-to-risk | Measured target justifies the risk taken |
| Written management rules | Entry, stop, and target documented before the trade |
Limits, Risk Controls, and Key Takeaways
When Continuation Patterns Fail
Before you enter, run through a last set of checks. A setup can look fine on the chart and still turn into a poor trade.
One common problem is a low-volume breakout. Price pushes through the pattern boundary, but there’s no follow-through. That often leads to a false move. Thinly traded stocks are hit by this more often, since price can jump around without much conviction.
Range-bound markets are another issue. If there’s no clear trend in the first place, there’s nothing for the pattern to continue. In that kind of market, the edge disappears.
News spikes can also wreck an otherwise clean setup. Price may break the pattern, pull traders in, then snap back the other way within minutes. It’s the sort of move that looks great at first glance and ugly right after.
One more check matters: the distance to the next major support or resistance level. If price doesn’t have much room to run, the trade may not pay enough to make the risk worth it, even if everything else lines up.
Use these failure checks as your final filter before committing capital.
Conclusion: A Simple Framework for Trend Confirmation
The process is simple: define the trend, spot the pause, wait for a close-based confirmation with above-average volume, place the stop outside the boundary, and set the measured target before entering. Continuation patterns tend to work best when trend, volume, risk, and execution line up.
FAQs
How do I know if the trend is strong enough?
Look for confirmation from price action, volume, and indicators before you act. ADX above 25 often points to a strong trend. Once it moves above 40, the trend may still be intact, but the move can also be stretched.
Volume matters too. It should back the move, ideally coming in at 1.5 to 2 times the 20-day average. If price breaks out but volume stays flat, that’s often a warning sign.
It also helps to check the bigger picture. Confirm the same direction on the daily or weekly chart, then use RSI or MACD to gauge momentum. And don’t jump in on a mere wick. Wait for a clear candle close beyond key support or resistance.
Should I enter on the breakout or wait for a retest?
It comes down to your risk tolerance and the way you trade.
Entering on the breakout lets you catch momentum early. The trade-off is higher risk. In choppy or volatile markets, false breakouts happen all the time, and they can sting.
Waiting for a retest gives you more confirmation. That said, you’ll often get a less favourable entry price because the move has already started.
To make the setup more reliable, look for a clear close beyond the level. It also helps to see volume at 1.5 to 2.0 times the recent average.
How do I spot a false breakout early?
Look for signs that the breakout doesn’t have much behind it. Low volume is one of the biggest warning signs. In most cases, a solid breakout comes with volume that’s around 1.5 to 2 times the 20-day average.
If price moves past a level but then closes back inside the pattern within 1 to 3 bars, that’s a red flag. The same goes if it retests the level and fails to stay above it. In both cases, the setup carries higher risk.
It also helps to stay patient. Don’t jump in just because of intraday wicks. Wait for a clear candle close beyond the level before you treat the breakout as valid.