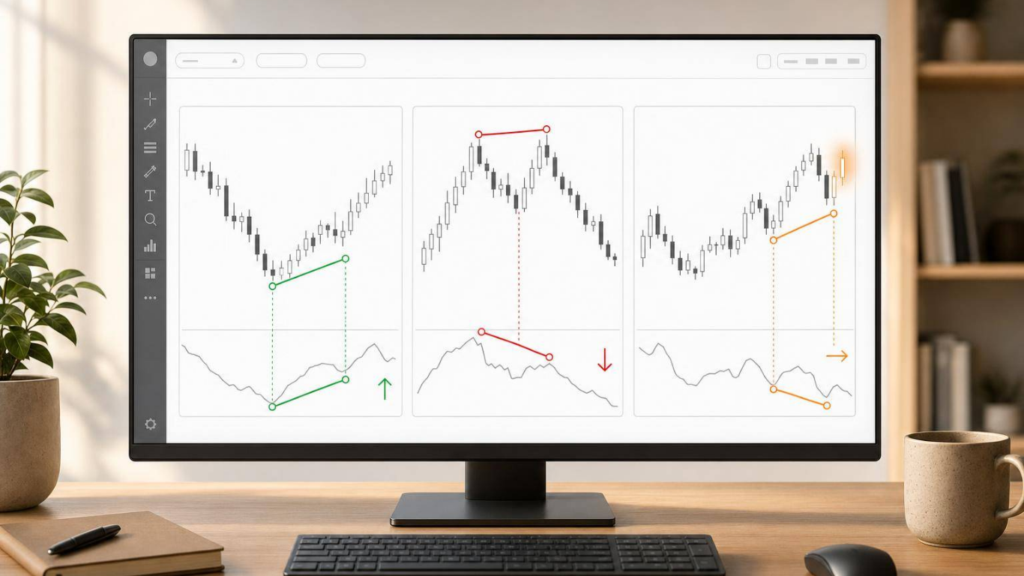
If you mix up regular and hidden momentum divergence, you can end up trading a reversal when the trend is more likely to continue.
Here’s my short take: divergence is for timing, not for prediction. I look at trend first, then the last 2 swings in price, then I match them with RSI or MACD. That simple order helps me tell whether I’m looking at regular bullish, regular bearish, or hidden divergence.
If you only remember 4 things, make it these:
- Regular bullish: price makes a lower low, indicator makes a higher low → possible upside reversal
- Regular bearish: price makes a higher high, indicator makes a lower high → possible downside reversal
- Hidden bullish: price makes a higher low, indicator makes a lower low → possible uptrend continuation
- Hidden bearish: price makes a lower high, indicator makes a higher high → possible downtrend continuation
About 50% of the job is just labelling the swing structure the right way. The other 50% is not acting too early. A divergence on its own is not an entry. I’d still wait for price to confirm with something clear, like:
- support or resistance
- a trendline break
- candlestick patterns
- a move back above or below a moving average
sbb-itb-466c9b0
Quick Comparison
| Type | Trend | Price | RSI / MACD | What it usually means |
|---|---|---|---|---|
| Regular Bullish | Downtrend | Lower low | Higher low | Reversal watch |
| Regular Bearish | Uptrend | Higher high | Lower high | Reversal watch |
| Hidden Bullish | Uptrend | Higher low | Lower low | Continuation watch |
| Hidden Bearish | Downtrend | Lower high | Higher high | Continuation watch |
The short version is simple: regular divergence warns of fading momentum, while hidden divergence leans with the main trend. That’s the filter I’d use before planning any trade.
How to Read Divergence Before You Label It
Divergence has two moving parts: price structure and momentum. Price shows you the swing pattern. RSI or MACD shows the force behind that move. When price and momentum stop agreeing, you have divergence.
The first step is simple: look at the last two swings in price before you name the setup.
Price Swings: Higher Highs, Lower Lows, Higher Lows, and Lower Highs
Every divergence setup begins with a two-swing comparison. You’re checking whether price made:
- a higher high
- a lower low
- a higher low
- a lower high
Then match those same peaks or troughs with RSI or MACD. For bearish setups, compare peak to peak. For bullish setups, compare trough to trough. If you misread the swing structure, you’ll label the divergence the wrong way. It’s that simple.
RSI and MACD as Common Momentum Reference Tools
RSI and MACD are common tools for reading momentum against price. The job here isn’t fancy. You just need to line up the right parts of the indicator with the right parts of price.
For bearish setups, match indicator peaks with price peaks. For bullish setups, match indicator troughs with price troughs. With MACD, shrinking histogram bars while price keeps printing new highs or new lows can hint that momentum is fading.
Still, the tool itself matters less than the market setting around it. RSI and MACD can both help, but neither should be read in isolation.
Trend Context Comes First
You need to read the trend before you classify the divergence. That’s where many traders slip up.
If price is in a clear uptrend and momentum starts to mismatch during a pullback, that usually points to hidden divergence. In plain English, that leans more towards continuation. But if price pushes to new highs while momentum weakens, that points to regular bearish divergence. That leans more towards exhaustion.
The trend is what separates those two readings. Once the trend is clear, the divergence label usually becomes much easier to pin down.
“In general, oscillators will perform better than trend indicators in range bound markets, while trend indicators like Moving Averages and MACD, will perform better in trendy environments.” – Collin Seow
Why Divergence Helps With Timing, Not Certainty
Divergence can warn you that momentum is shifting, but it does not tell you the exact turning point.
“Traders should note that prices can stay overbought or oversold for extended periods of time, especially during trending periods.” – Collin Seow
That’s why divergence works better as a warning sign, not a direct entry signal. Think of it as a heads-up. You still want a price action trigger before acting.
That trigger might be:
- a support or resistance level
- a trendline break
- a reversal candlestick pattern
Used this way, divergence helps you sort out whether you’re looking at regular bullish divergence or hidden divergence without jumping in too early.
1. Regular Bullish Divergence
When price makes a lower low but momentum doesn’t, this is the first reversal pattern to watch. Regular bullish divergence is a reversal warning: price makes a lower low, but RSI or MACD makes a higher low.
Trend Context
This tends to show up near the end of a downtrend, when selling pressure starts to lose steam.
Price Swing Structure
Price prints a lower low – a new swing low below the last one. On the chart, price still looks bearish. That’s why this setup is easy to miss.
Momentum Indicator Structure
At the same time, the momentum indicator – such as RSI or MACD – fails to make a new low. That gap between price and momentum is the divergence.
“Histogram is an indication of trend strength… it will react faster than a crossover in identifying weakening trend.” – Collin Seow
The MACD histogram can point to fading momentum earlier than a line crossover.
Timing Role
Regular bullish divergence does not mean the bottom is guaranteed. It only tells you that selling pressure may be fading. Treat it as an early warning, then wait for price confirmation before you act.
The opposite pattern is regular bearish divergence.
Master Systematic Trading with Collin Seow
Learn proven trading strategies, improve your market timing, and achieve financial success with our expert-led courses and resources.
2. Regular Bearish Divergence
Regular bearish divergence is the opposite of regular bullish divergence. It shows up when price makes a higher high, but RSI or MACD makes a lower high. On the chart, price may still look strong. But under the surface, momentum isn’t keeping up.
Trend Context
This pattern usually forms during an uptrend and often points to buying pressure starting to run out.
“Traders should note that prices can stay overbought or oversold for extended periods of time, especially during trending periods.” – Collin Seow
That matters because an overbought reading on its own doesn’t mean price will turn right away. In a strong uptrend, price can keep pushing up for some time.
Price Swing Structure
Price forms a higher high, which means the second swing peak sits above the first. So from a pure price-action view, the uptrend is still in place.
Momentum Indicator Structure
At the same time, RSI or MACD forms a lower high. In plain terms, the indicator fails to confirm the new price peak. That’s a sign momentum is weakening even though price is still moving up.
“Histogram is an indication of trend strength… it will react faster than a crossover in identifying weakening trend, but will generate more false signals.” – Collin Seow
So if you’re using MACD, the histogram may warn you earlier than the crossover. The trade-off is simple: earlier signals, but more false alarms.
Timing Role
Regular bearish divergence does not promise a reversal. Think of it as an early warning sign, not a sell signal by itself. Traders often use it to tighten stops on long positions, map out exits, or get ready for short setups. Then they wait for confirmation, such as a bearish candlestick or a break below a trendline.
The same swing structure also helps you tell this reversal setup apart from hidden divergence, which usually points to continuation.
3. Hidden Divergence
Hidden divergence is different from regular divergence in one big way: it goes with the trend.
So while regular divergence points to a possible reversal, hidden divergence points to trend continuation. Price pulls back within the main trend, and momentum softens during that pullback.
That distinction matters. If you mix the two up, your trade idea can flip on its head. The safer approach is simple: read the trend first, then compare the last two swings in price and momentum before you label anything as divergence.
Trend Context
Hidden bullish divergence forms during an uptrend. Hidden bearish divergence forms during a downtrend.
Before you label divergence, confirm the start of new trends first. You can do that with a moving average or by reading price structure.
Price Swing Structure
Hidden bullish means price makes a higher low. Hidden bearish means price makes a lower high.
In hidden bullish divergence, the pullback stays above the prior low. That means the uptrend structure is still intact.
In hidden bearish divergence, the bounce stops below the prior high. That keeps the downtrend structure in place.
Momentum Indicator Structure
With hidden bullish divergence, RSI or MACD makes a lower low even though price holds a higher low. With hidden bearish divergence, the indicator makes a higher high even though price only prints a lower high.
- Hidden bullish: price makes a higher low, RSI/MACD makes a lower low.
- Hidden bearish: price makes a lower high, RSI/MACD makes a higher high.
That mismatch shows that counter-trend momentum has run out, even though price has not broken the main trend structure.
Timing Role
Hidden divergence is a trend re-entry tool. In plain terms, you’re looking for a chance to get back into the trend after a pullback.
Still, don’t jump in too early. You want confirmation. A bullish engulfing candle or a trendline break can act as your trigger before entry.
The next step is avoiding common labelling mistakes.
Common Mistakes When Labelling Bullish, Bearish, and Hidden Divergence
Once these three patterns make sense, the next place traders slip up is the labelling. It happens a lot. People spot a mismatch between price and an indicator, then rush to name it before they’ve checked the swing pattern and trend.
That’s the main error: labelling the divergence first instead of confirming the price structure first.
Regular Bullish vs Hidden Bullish
Both setups compare lows, but they mean very different things:
- Regular bullish: lower low in price + higher low in indicator → reversal signal
- Hidden bullish: higher low in price + lower low in indicator → continuation signal
Mix those up, and you change the whole read on the chart. One says the move down may be running out of steam. The other says the uptrend may still be intact after a pullback.
Regular Bearish vs Hidden Bearish
These two compare highs, and the same issue shows up here:
- Regular bearish: higher high in price + lower high in indicator → reversal signal
- Hidden bearish: lower high in price + higher high in indicator → continuation signal
Confusing them flips the setup completely. One points to a possible reversal near a top. The other suggests the downtrend may be about to continue.
Reversal Signal vs Continuation Signal
This is the line that tells you whether you’re looking at a reversal trade or a pullback entry.
Regular divergence warns that momentum may be fading.
Hidden divergence suggests the current trend may resume.
“Timing becomes everything in these situations. Acting too quickly on the first signal without waiting for both indicators to align can lead to premature entries and unnecessary losses.” – Bryan Ang
Check the Swing Pattern Before Labelling the Setup
Start with the price swing sequence. That comes first. Only after the price structure is clear should you look at the indicator and name the setup.
In plain terms: check the swing pattern first, then label the divergence.
How to Use Momentum Divergence in a Market Timing Plan
Once you can label the setup, plug it into a timing plan. Keep it simple: define the trend, spot the setup, then wait for confirmation. That separation matters. Trend, setup, and entry are not the same thing.
A clean way to do this is to use three timeframes:
- A higher timeframe for trend
- Your main timeframe for divergence
- A lower timeframe for entry
That structure helps you avoid jumping in too early just because you saw a signal.
Use Regular Bullish Divergence to Watch for Selling Exhaustion
When selling pressure starts to fade, treat it as an early warning. It can mean a reversal is starting to take shape, but it is not your entry by itself.
Let price prove it. For example, wait for a close above a 20-period moving average or another clear trigger before you act.
Use Regular Bearish Divergence to Watch for Buying Exhaustion
When buying pressure looks like it is losing steam, take that as a warning sign. It can be a cue to tighten trailing stops on existing long positions or get ready for a short setup.
Think of it as an alert for a possible pullback, not a standalone entry signal. Do not trade the divergence alone.
Use Hidden Divergence to Time Pullbacks Within the Trend
Hidden divergence is more useful for continuation than reversal. In plain terms, it can help you time re-entries after a pullback inside an established trend.
Before you look for the divergence on your trading timeframe, confirm the trend first. You can do that with a higher timeframe, such as weekly charts, or with a 20-period moving average.
Turn Divergence Into a Rules-Based Process
Use divergence through a fixed workflow, not gut feel from one chart to the next. The goal is to make the setup repeatable.
- Identify the primary trend.
- Mark the last two swings and name the divergence.
- Wait for a confirmation trigger.
- Set the stop with ATR-based room.
Next, compare reversal and continuation signals side by side.
Quick Comparison Table: Reversal vs Continuation Signals
Now compare the four setups side by side so the labels don’t get mixed up.
Use this quick check after reading the swing structure.
| Divergence Type | Trend Context | Price Pattern | Indicator Pattern | Likely Meaning | Typical Timing Use |
|---|---|---|---|---|---|
| Regular Bullish | Downtrend | Lower Low (LL) | Higher Low (HL) | Bullish Reversal | Watch for selling exhaustion |
| Regular Bearish | Uptrend | Higher High (HH) | Lower High (LH) | Bearish Reversal | Watch for buying exhaustion |
| Hidden Bullish | Uptrend | Higher Low (HL) | Lower Low (LL) | Trend Continuation | Time pullbacks for re-entry in uptrend |
| Hidden Bearish | Downtrend | Lower High (LH) | Higher High (HH) | Trend Continuation | Time pullbacks for re-entry in downtrend |
Use the table to confirm reversal vs continuation at a glance.
You can also treat it like a quick checklist:
- Confirm the trend first
- Match lows for bullish setups
- Match highs for bearish setups
Hidden bullish is the one people mix up most often: price makes a higher low, while RSI or MACD makes a lower low.
Conclusion
Regular divergence warns that a reversal may be near. Hidden divergence points to trend continuation. That’s the simplest way to tell reversal setups from continuation setups.
Start with the trend. Then compare price swings with RSI or MACD before you label the setup. Don’t treat divergence as a trigger on its own. Use it as a timing filter, and pair it with risk management inside a rules-based process.
Read the trend first. Label the setup second. Enter only after confirmation. Divergence helps with timing – it does not predict direction.
FAQs
Which indicator is better for divergence: RSI or MACD?
Neither is objectively better. Each works best in different market conditions.
RSI is often the go-to in range-bound markets. It helps traders spot overbought or oversold conditions and watch for possible reversals.
MACD tends to be more useful in trending markets. It helps track shifts in momentum and confirm the direction of the trend.
A lot of traders use both together. They look to RSI for possible reversal setups, then use MACD to confirm the trend and cut down on false signals.
How do I know if a divergence is valid or just noise?
Check it against the current market regime, then confirm it with secondary indicators. That part matters more than many traders think.
Regular divergence tends to work better when the market is moving sideways and reversal setups are more common. Hidden divergence is usually more useful when the market is already trending and you’re looking for continuation instead of a turn.
To cut down on noise, confirm the trend direction with the 200-period Simple Moving Average or ADX. You can also pair RSI with a volume spike or a MACD crossover to help validate the signal and reduce false positives.
What confirmation should I wait for before entering a trade?
Wait for multiple signals to line up, not just one.
Start by checking the bigger trend. You can do that with the 200-period Simple Moving Average or ADX above 25.
Then look for price to close clearly above resistance or below support. It helps if that move comes with higher volume. After that, check momentum for extra confirmation, such as:
- RSI moving back above 30
- A MACD signal-line crossover
It also helps to check the higher timeframe first, then fine-tune your entry on the lower timeframe. That extra step can weed out a lot of false signals.