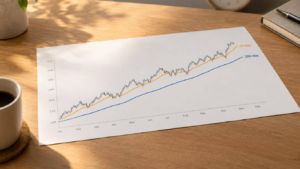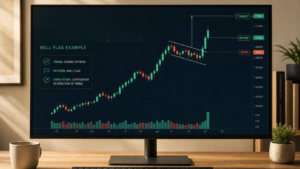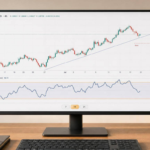
Volume gets you in faster, candle closes filter noise, and breakout confirmation helps validate moves — together they cut trades but sharpen signals.
Here’s the short version for you:
- Volume confirmation checks whether a breakout has enough market participation.
- Close confirmation checks whether price can stay above resistance by the end of the session.
- Volume is faster, but it can react to short-lived spikes.
- The close is slower, but it can screen out many intraday fake moves.
- A 1.5× to 2.0× RVOL filter may lift trade quality, but it can also cut signal count hard.
- A single close, % close above resistance, or two closes each change the balance between early entry and false-break risk.
- If I trade thin SGX counters, I would be more careful with volume data.
- If I trade end-of-day, the daily close is often simpler to follow and test.
- The only fair way to choose is to test both on the same breakout level, same stop rule, and same costs.
One stat stands out: one study cited a 63% breakout failure rate. So this is not about finding a magic filter. It is about deciding what matters more in my systematic trading program: getting in sooner or waiting for extra proof.
sbb-itb-466c9b0
Quick Comparison
| Method | Entry timing | Main strength | Main weakness | Best fit |
|---|---|---|---|---|
| Volume surge | Earlier | Spots interest fast | Can fire on noisy spikes | Liquid counters with cleaner volume |
| Candle close | Later | Cuts intraday noise | Entry may be at a higher price | End-of-day trading, patchy volume data |
| Volume + close | Latest | Lowest false-signal risk | Fewer setups | Choppy or volatile markets |
If you want the simple takeaway before reading the rest: use volume when data is clean and timing matters; use the close when you want simpler rules; use both only if the drop in trade count still leaves you with better net results after fees and slippage.
Master Systematic Trading with Collin Seow
Learn proven trading strategies, improve your market timing, and achieve financial success with our expert-led courses and resources.
2. Volume Surge Confirmation
Volume confirmation tells you whether a breakout has actual backing. Price can pop above resistance for a moment, but if participation doesn’t pick up, that move can fade fast. That’s why volume helps judge a breakout by participation, not price alone. It can get you in earlier, but only when the spike means something.
A common way to measure this is relative volume (RVOL): current volume divided by the average volume over the past 10 to 20 bars. A simple rule is to use RVOL ≥ 1.5× as a basic filter and RVOL ≥ 2.0× as a stricter one. In plain terms, RVOL matters most when participation matters more than speed.
The numbers make the trade-off pretty clear. One multi-year breakout study found that unfiltered breakouts had a win rate of 37% and a profit factor of 0.92. Adding a 1.5× volume filter pushed the win rate up to 61% and the profit factor to 1.58. At 2.0×, the win rate climbed to 72% with a profit factor of 1.84, but there were only 18 signals across three years. So yes, quality improved, but the number of trades dropped. That’s the classic trade-off: frequency versus quality.
2.1 When volume confirmation works better
Exchange-reported volume is cleaner, so RVOL tends to be more dependable in SGX-listed equities than in thinly traded counters. In thin counters, one block trade can throw off RVOL and make participation look stronger than it is. On paper, the setup looks fine. In practice, there may be no proper follow-through.
That’s the catch with volume confirmation. Its edge comes from cleaner data, and that same feature can work against you when volume is noisy or easy to distort.
2.2 Strengths and limits of volume filters
The main plus of a volume filter is simple: it cuts out a lot of low-conviction breakouts before they turn into losing trades. Breakouts on sub-average volume have a success rate of only 27%, compared with 72% for breakouts with 2× average volume.
It’s also easy to test. You compute a moving average of volume over N bars, check whether current volume is above that average by your chosen multiple, and only take the signal if it passes.
Still, volume filters have limits. Some valid breakouts happen on only moderate volume – around 1.2× to 1.4× average – especially in quieter markets or during non-news sessions. If you demand 2.0× in those conditions, you may skip trades that later move well.
There are data issues too. Delayed prints or thinly traded counters can distort RVOL readings. So it helps to treat RVOL as a filter, not a stand-alone entry rule.
When volume data can’t be trusted, many traders switch to candle-close confirmation instead. In that case, they wait for price to close above resistance even if there isn’t a volume spike.
3. Candle Close Above Resistance
When volume data gets messy, the closing price is often the cleaner way to test a breakout. “Candle close above resistance” means the final closing price of a candle finishes above a resistance level. It does not mean price merely poked above that level during the day.
Resistance is usually a prior swing high, a zone, or a round number like SGD 1.00 or SGD 10.00. Some traders treat resistance as a zone instead of a single line. In that case, the close has to finish above the top end of that zone for the breakout to count.
Don’t act on an intraday spike above resistance. Wait for the candle to close. An intraday move above resistance is not a breakout on its own.
You can set the rule with different levels of strictness:
- A single close above resistance is the fastest trigger.
- A minimum percentage close above the level, such as 0.5% to 2.0% for equities, asks for more follow-through before entry.
- Two consecutive closes above resistance are the strictest option and are often used on weekly charts.
3.1 When close confirmation works better
Close confirmation works best when volume data is patchy or unreliable. That can happen with smaller SGX counters, where reported volume may not tell you much as a breakout filter. In that kind of setup, the closing price becomes the cleaner signal.
It also suits daily and weekly charts well, since each candle covers a full session or a full week of buying and selling. If you mark resistance on a daily chart, confirm it with a daily close. If you’re using a weekly chart, use the weekly close.
This method also fits many Singapore traders who check charts after work. Since the signal is only judged after the candle closes, there’s no need to sit in front of the market during the day. End-of-day rules are practical, consistent, and easier to backtest.
3.2 Strengths and limits of waiting for the close
The biggest strength here is noise reduction. Waiting for the close filters out intraday spikes that move above resistance for a moment, then fall back into the prior range by the end of the session. It also gives you a cleaner and more objective signal, which makes the rule easier to code, test, and follow without second-guessing.
The downside is simple: you usually enter later, and often at a higher price. If resistance sits at SGD 1.00 and the candle closes at SGD 1.05, your entry is now higher, and your stop will often need to be wider too. On fast breakouts, waiting for the close can mean giving up a big part of the move. In some cases, you may miss it altogether if the breakout fails before the session ends.
| Rule Variation | Entry Speed | False Break Risk | Stop Distance |
|---|---|---|---|
| Single close above resistance | Moderate | Moderate | Moderate |
| Minimum % close beyond resistance | Slower | Lower | Wider |
| Two consecutive closes above resistance | Slowest | Lowest | Widest |
The real trade-off is speed versus reliability, which the next section compares side by side.
4. Volume vs Close: Entry Speed, Reliability, and System Design
The main issue isn’t whether one rule beats the other. It’s how each rule changes when you get in and how much false-signal risk you take on. If volume and close point in different directions, your system has to choose: do you want an earlier entry, or do you want tougher confirmation?
A volume surge can fire before the candle closes, which makes it faster. A candle close is slower, but it shows buyers managed to keep price above resistance for the full session.
4.1 Side-by-side comparison of common breakout scenarios
The table below lays out four common breakout states.
| Scenario | Price Action | Volume | Interpretation |
|---|---|---|---|
| Strong volume, marginal close | Price barely above resistance at close | Significant surge above average | High interest but heavy resistance; elevated risk of a bull trap or reversal |
| Strong close, average volume | Decisive close well above resistance | Normal or below-average | Limited conviction; move may lack follow-through |
| Both signals aligned | Decisive close above resistance | Significant surge above average | Usually the most reliable setup; participation is rising and the market accepted the higher price |
| Wick-only breakout | Long upper wick; close below resistance | Weak or low volume | Price rejection; sellers regained control – likely a false breakout |
When both signals line up, breakout follow-through is usually strongest.
That matters because each breakout state can call for a different entry rule. Here’s the direct comparison across the three main confirmation methods:
| Feature | Volume Surge | Candle Close | Combined Rule |
|---|---|---|---|
| Entry speed | Fast | Slower | Slowest |
| Reliability | Moderate | High | Highest |
| Market suitability | Liquid, high-turnover instruments | All conditions; suits end-of-day systems | Volatile or choppy markets |
| Typical weakness | Can trigger on speculative spikes | May enter on weak conviction | Fewer trades; later entries |
| False signal risk | Higher on narrow-range bars | Moderate (wick traps still possible) | Lowest |
4.2 Using both rules together in one trading system
Using both rules at once – a decisive close above resistance plus above-average volume – makes the setup more selective and often improves signal quality. But there’s a trade-off. A relative volume filter of ≥1.5× usually cuts trade count by about 40–50%. Push that to ≥2.0×, and you may end up with 60–70% fewer signals.
That’s a big drop in opportunity. It also means some valid breakouts, especially on quieter days, won’t make it through the filter.
So keep the rule simple. Then test whether it improves your net edge after costs across instruments and timeframes. That’s the part that counts. A rule can look good on paper and still fall apart once costs and slippage show up.
What you want to know is simple: does the combined rule improve your net edge after costs, and does that hold up on data that wasn’t used to build the rule?
The next step is to test which rule survives costs and slippage in your own market.
5. How to Test Both Methods
If you want a fair answer, test both methods on the same breakout level with the same risk rules. That way, you’re not mixing up the result. Backtest both before you decide which one to use.
5.1 A simple test framework for Singapore traders
Start with one fixed breakout reference, such as the highest close over the past 20 trading days. Once that reference price is locked in, build two separate rule sets and keep everything else the same: same instruments, same lookback period, same stop method.
Rule Set A (volume confirmation): Enter long when price trades above the resistance level and today’s volume is at least 1.5× the 20-day average volume.
Rule Set B (close confirmation): Enter long only when the daily close is at least 0.5–1.0% above resistance, no matter what volume does.
For stops, place them either just below the breakout level or below the prior swing low. Use the same stop method for both rule sets, so the only thing you’re testing is the confirmation rule.
For SGX traders, a daily-candle approach works well for after-hours review. You check the close, place the order, then execute in the next session.
Set your risk per trade in S$. A simple rule is to risk 1–2% of account equity per trade. On a S$50,000 account, that means no more than S$500–S$1,000 at risk on each trade. Work out your share size from the entry price, stop distance, and your S$ risk amount – not from some random lot size.
Run the backtest over at least 5–10 years of historical daily data. That gives you a better spread of calm periods and volatile ones. Then compare both rule sets using the same scorecard:
| Metric | What to look for |
|---|---|
| Win rate | Percentage of profitable trades |
| Average S$ return per trade | Net gain per trade after costs |
| Maximum drawdown | Largest peak-to-trough equity decline in S$ |
| Trade frequency | Number of signals generated per year |
| Profit factor | Gross profit divided by gross loss; target above 1.5 |
| Sharpe ratio | Risk-adjusted return measure; target above 1.0 |
Include realistic brokerage and clearing fees. This part matters more than many traders think. Fast volume breakouts can slip more on entry, so don’t assume you’ll always get a perfect fill.
For systematic trading resources, Collin Seow Trading Academy provides books, free e-courses, webinars, and video content on backtesting and risk control.
5.2 Key takeaways
Volume is faster. Close is simpler and often cleaner.
Volume confirmation depends more on data quality. It also can fire on speculative spikes. Close confirmation asks price to stay above resistance into the close, which helps filter intraday noise.
Your best option depends on the instruments you trade, your timeframe, and whether you can watch the market during SGX hours. A thinly traded SGX mid-cap can move very differently from a liquid blue chip. What looks good on one chart may fall apart on another.
Test both on the same dataset. Then keep the rule that gives you better net S$ return, drawdown, and trade frequency after costs.
FAQs
Which confirmation suits my trading style?
It depends on your risk tolerance, the market setup, and how fast you trade.
If you want earlier entries and you’re okay with more price swings, a volume surge may fit you better. If you care more about reliability and want fewer false breakouts, it makes sense to wait for a candle to close above resistance.
At Collin Seow Trading Academy, many traders use both signals together: a confirmed close above resistance, plus a volume spike of 1.5 to 2.0 times the average.
How do I set a good RVOL threshold?
A useful relative volume (RVOL) threshold for breakout confirmation is usually 1.5x to 2.0x the average volume.
Some setups may treat a 20% to 30% increase above the recent average as worth noting. But in practice, higher thresholds tend to work better.
If volume stays below these levels, the breakout may be a false move or a stop-loss hunt.
What is the best breakout test setup?
The best breakout test setup combines price action with volume confirmation to cut down on false signals.
Start with the candle itself. You want the candle body to close cleanly beyond resistance or support, not just poke through it. As a rule of thumb, the body should make up at least 50% of the candle’s full range. That helps show the move had some conviction instead of being a brief spike.
Then check volume. A breakout means more when it’s backed by a clear jump in activity, usually around 1.5 to 2 times the recent average. No volume push? That breakout can fizzle out fast.
A multi-timeframe approach can tighten the setup even more. If the breakout on your trading timeframe lines up with the bigger trend on a higher timeframe, the trade often looks cleaner and gives you more confidence in the signal.