About the Security (NASDAQ: INTC)
Intel Corporation is an American multinational technology company headquartered in Santa Clara, California. Intel designs, manufactures, and sells computer components such as central processing units and related products for business and consumer markets, according to Wikipedia.
It was reportedly the world’s third-largest semiconductor chip manufacturer by revenue in 2024.
Stock background:
Intel shares have soared in recent months, up 200% since the end of March, on surging interest in chip stocks (peers Micron and Qualcomm have witnessed a similar rise).
AI infrastructure boom, new partnerships in Foundry, and reports that the company is in preliminary discussions with Apple to manufacture chips have contributed to the massive jump in the stock.
Around mid-August 2025, we highlighted Intel as a potential stock to watch. See “Intel: Preparing to Take Off?”, dated 20 August 2025. In October 2025, signs were emerging that a meaningful bottom was in place – “Intel: A Meaningful Turnaround,” published 9 October 2025.
Intel reported strong Q1 2026 earnings in April, beating analyst topline and EPS estimates. The company’s data center and AI contributed to over 20% growth, while the Intel Foundry business clocked a growth of 16%.
Intel (Weekly):
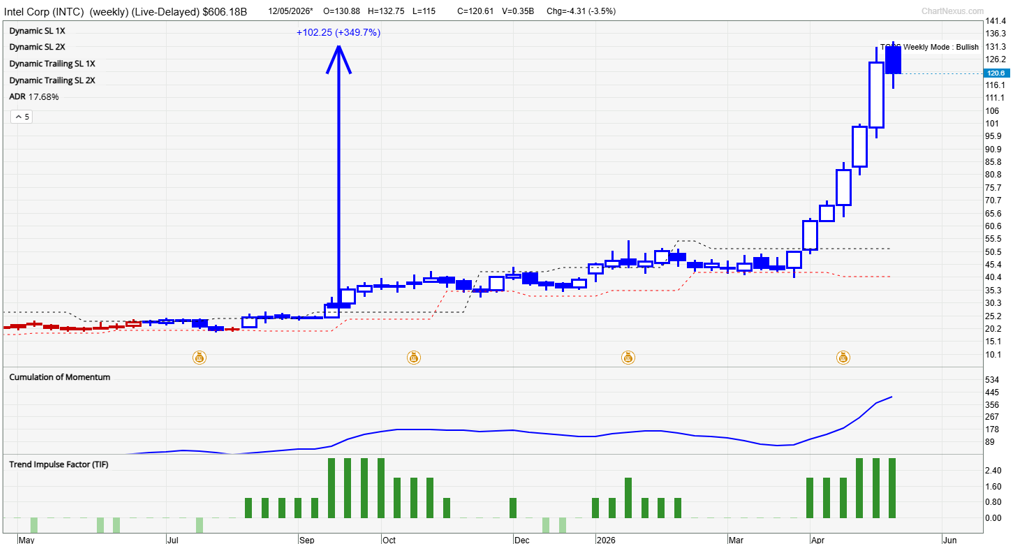
Technical Analysis on Intel (NASDAQ: INTC)
Our proprietary system, TradersGPS (TGPS), turned bullish on the stock in mid-2025.
Blue candles indicate the stock’s trend is up. Red candles indicate the trend is down. As we noted in the update last year, the unique feature of the turnaround last year was the momentum, reflected in the wide blue candles last year.
The upsurge in momentum coincided with a break in key resistance at 27-28. The stock hasn’t looked back since the bullish breakout.
A noteworthy feature of the TGPS system is that it has been able to capture the entire uptrend, giving subscribers a chance to participate in the trend. The conflict in the Middle East has done little to alter that trend.
Intel (Weekly):
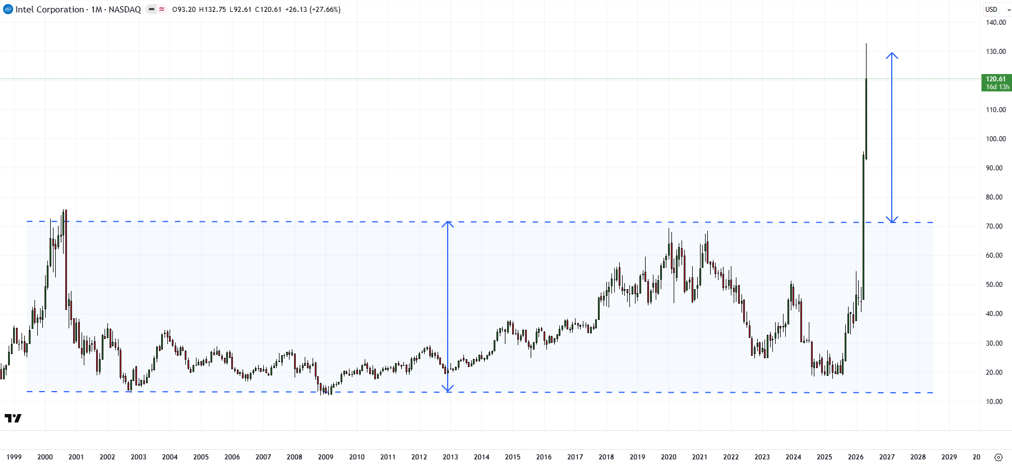
Trading Strategy: Strong Trend but Watch for Pullbacks
On technical charts, the surge in the stock took out major resistance at the year 2000 record high of 75.70, coinciding with the 2020 high.
In general, there is a tendency for some consolidation/minor retreat at material resistance levels, but the lack of it in this case is a reflection of the strength of the uptrend.
The break above the resistance triggered a breakout from a near-three decade sideway pattern. The breakout managed to hit the price objective of the long-established sideways pattern.
Furthermore, the break has put the stock on an upward trajectory after more than two decades.
Having said that, extreme overbought conditions do point to some consolidation in the near term – the 14-week Relative Strength Index hit 90 earlier this month (levels above 70 are considered overbought).