This article is for education purposes only, and not to be taken as advice to buy/sell. Please do your own due diligence before committing to any trade/investment.
The spike in oil prices and drop in the price of precious metals sent the shares of many mining companies lower through March and April. High oil prices due to transportation disruption also sent motorists into a frenzy. Long queues were spotted in many countries.
As the price of oil stabilizes by hovering around $100 a barrel, and the price of precious metals recovers, the shares of mining companies are picking up from where they left off.
This also presents us with exciting position trading opportunities, opportunities that I’ve been waiting for for months.
Are you excited to learn all about this mining stock that rose by over 70% in 2026 before the war in the Middle East?
Brief History of Hecla Mining
![]()
Source: hecla.com
Hecla Mining was founded in 1891, the oldest miner in North America that’s listed in the US.
Upon its founding, the company quickly moved to take over small and inefficient mining companies.
Over time, Hecla Mining perfected 1 mining method to safely mine at depths over 6,000 feet. This resulted in a spike in productivity.
The company has also embraced advanced, green technologies across its operations.
As the company continues to grow and innovate, are its shares worth buying for a position trade?
Business Model and Financials
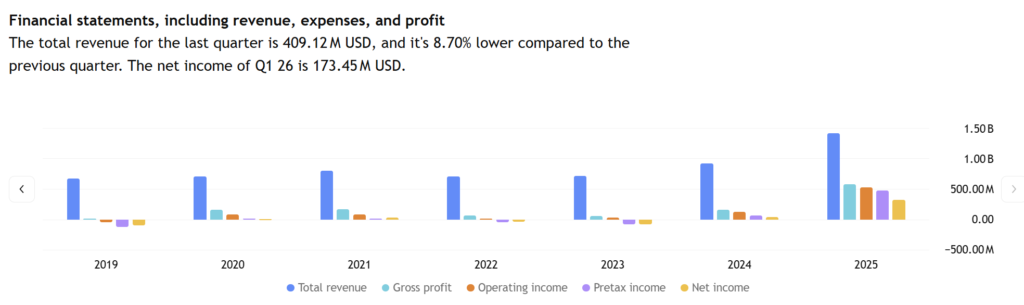
Source: tradingview.com
Let’s look at 2 key metrics from the image above – total revenue (in blue) and net income (in yellow).
Did you notice that the total revenue of Hecla Mining grew every year except for 2022?
This consistent growth in its total revenue is highly welcomed in any sector.
Here’s another important fundamental metric to consider: net income.
Can the same be said of its net income?
Hecla Mining’s net income has been swinging like a pendulum, but without a clear rhythm. This is normal for capital-intensive and cyclical companies such as Hecla Mining. Therefore, I don’t see any cause for concern regarding its net income.
Are these strong enough reasons to consider buying the shares of Hecla Mining for a position trade?
Let’s have a look at its stock chart to provide more clarity.
Technical Analysis on Hecla Mining (NYSE: HL)
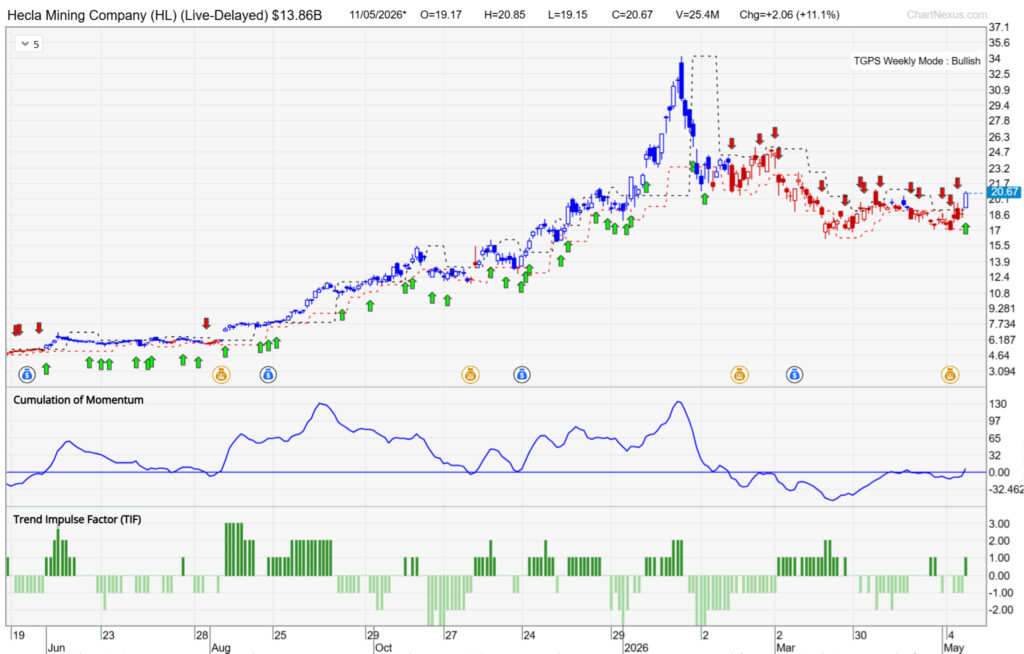
This is the chart of Hecla Mining’s stock.
What can you infer from it?
I can tell that Hecla Mining’s shares were in a massive uptrend from June 2025 to Feb 2026. A correction ensued due to the war in the Middle East, which sent oil prices skyrocketing and dampened demand for precious metals.
However, the bulls are back. How do I know this?
The color of the candles in a bullish season is usually blue in color (outlines and solid). When they are red for a period of time, you can tell that the stock is in a downtrend.
Now, the color of the candle has turned blue (outlined), and there’s a green arrow under it.
When there’s a green arrow under a blue (outlined or solid) candle, it signals a fresh bullish move.
Let’s turn our attention to the other proprietary indicator – Trend Impulse Factor.
The Trend Impulse Factor indicator is curated to inform traders whether the move in the market is likely to be sustainable, giving you and I an edge.
When the bar of the Trend Impulse Factor indicator is dark green in color, it suggests that this bullish move is likely to be sustained. Now, let’s have a look at the color of the Trend Impulse Factor indicator’s bar.
It’s dark green in color, suggesting that the time to buy its shares for a position trade is here!
If you’re wondering whether you need to draw your support and resistance or trendlines, you don’t have to with this trading system.
Conclusion

Source: unsplash.com
As the world has come to terms with elevated oil prices, stock markets around the world are no longer as responsive to the situation in the Middle East.
Stocks that have been battered are beginning to bottom out, presenting fantastic position trading opportunities. One such stock is Hecla Mining.
Its year-on-year growth in revenue is impressive. What’s more impressive is its stock performance before the war.
It has soared more than 70%, bringing its share price above $34. Thanks to the war in the Middle East, its share price stands at $20, presenting us with a long-awaited position trading opportunity.
And the system I use, TradersGPS (TGPS), indicates that the opportunity is here.
Both the arrow and Trend Impulse Factor indicators have been tested and proven. They form the TradersGPS (TGPS) system to help you decipher if a stock is ripe for a position trade. You won’t have to feel in the dark and make wild guesses.
What are your thoughts?
Share your thoughts with me below!