About the Security (HKEX: 700)
Tencent Holdings is a world-leading internet and technology company that develops innovative products and services, including video games, cloud computing, advertising, artificial intelligence (AI), and digital content.
It operates instant messengers Tencent QQ and WeChat, along with the news site QQ.com.
Stock background:
What seemed like the resumption of the uptrend turned out to be a disappointment for bulls. After a solid three-year uptrend that began in 2022, Tencent shares have reversed gains, with the stock continuing to make lower lows on longer-term charts.
The primary driver of the weakness in the stock is concerns regarding massive artificial intelligence (AI) investments, which could lead to slower profit growth. In 2025, the company posted mid-double-digit growth in operating profit.
However, with aggressive capital expenditure, the operating profit growth could slip to single digits, according to some analysts.
While the early-move advantage could work in favor of Tencent, the uncertainty is that sizeable capital expenditure is not monetized enough, exerting pressure on profit margin. The Q1 2026 earnings released earlier this month did little to soothe investor concerns.
The company reported total revenue growth of 9% on-year, lower than analysts’ expectations. However, net profit beat analyst expectations.
Tencent Holdings (Weekly):
Technical Analysis on Tencent Holdings (HKSE: 700)
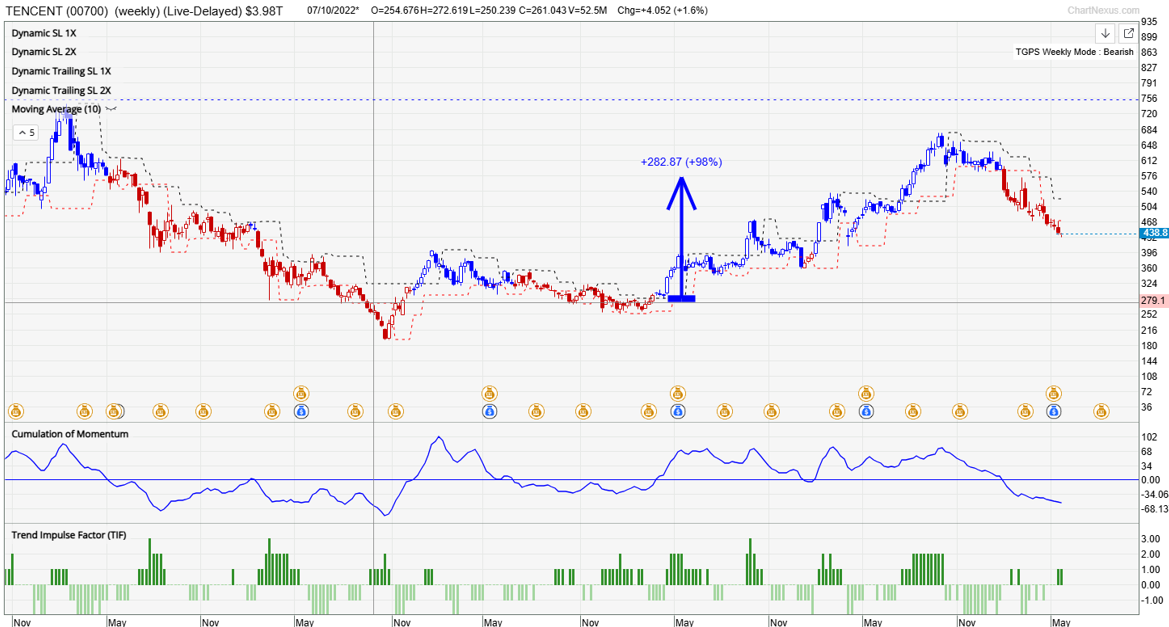
Our proprietary system, TradersGPS (TGPS), was quick to point out the impending weakness in the stock.
As per our system, Blue candles indicate the stock’s trend is up. Red candles indicate the trend is down. The candle colour turned Red at the start of 2026, warning of a reversal of the uptrend.
A noteworthy feature is that the system gave a bearish signal even before an actual support was broken. This shows the advanced prediction mechanism built into the model.
The decline in 2021-2022 was of a similar nature – the candle color changed Red in 2021, before the actual break of a pivot support (see Weekly chart).
Tencent Holdings (Weekly):
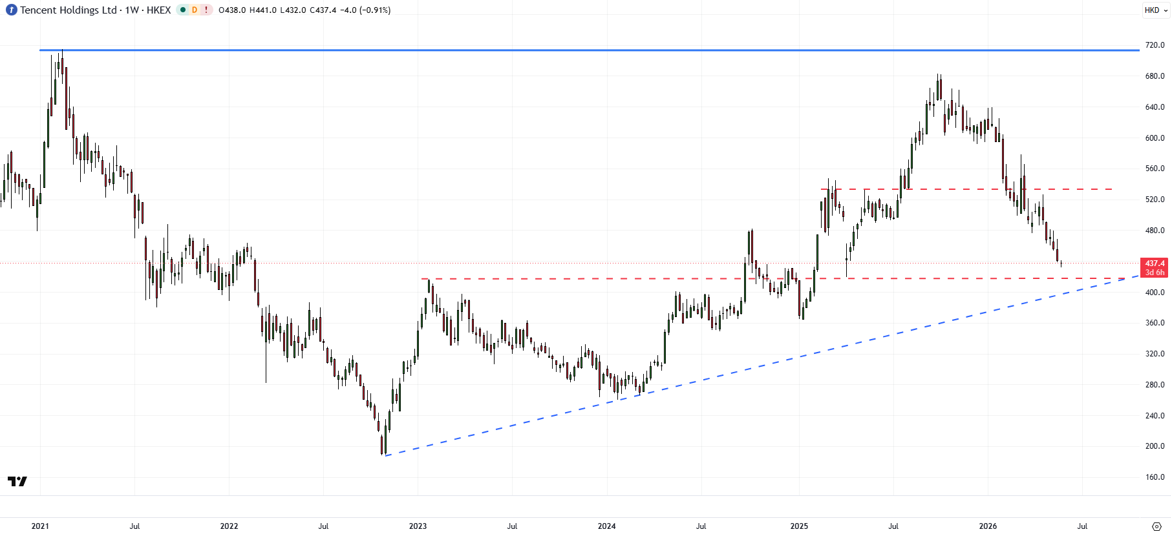
On technical charts, Tencent shares pulled back from near major resistance at the 2021 high of 715. What seemed like a minor retreat ahead of formidable resistance turned out to be a catalyst for a breakdown in the uptrend.
The subsequent fall below support at the March 2025 and May 2025 highs of 530-550 triggered further weakness in the stock. Still, all is not lost as the stock is holding about key converged support at 400-420 (the January 2023 high, coinciding with an uptrend line from October 2022).
A hold above the support is vital for the broader recovery to continue (that started in 2022). A failure to hold above could pave the way toward the August 2024 low of 350.
Trading Strategy:
Given the candle colour on the daily and weekly charts is Red, I prefer to stay on the sidelines for the time being.
The recent decline could entice aggressive investors. However, it would be best not to catch a “falling knife”! I would much rather wait for a bullish reversal signal before considering longs.