About the Stock (NASDAQ: MSFT)
Microsoft Corporation is an American multinational technology conglomerate headquartered in Washington.
From the initial days of providing computer operating software like Windows, the company has expanded to internet services, cloud computing, artificial intelligence, gaming, and other businesses, including collaborations with governments and enterprises.
Stock background:
Microsoft shares have rebounded over 20% after reaching an 11-month low in March, and are up about 18% since our previous update, “Microsoft: May Be Time to be Constructive,” dated April 1.
The US-Iran temporary ceasefire, deeply oversold conditions, and optimism related to the Q1-2026 earnings season were instrumental in triggering a rebound in April. At one point, the stock was down 35% from the record high hit in 2025.
The earnings season has been solid so far, with the blended net profit margin for the S&P 500 index at its highest at least since 2009, according to FactSet. Roughly a third of the companies in the S&P 500 index have reported so far, and around 80% of the companies have beaten expectations. Microsoft was no exception.
Microsoft announced its quarterly results, beating estimates on the top and bottom lines.
However, the guidance fell short of expectations. Concerns regarding the company’s capital expenditure and return on artificial intelligence (AI) infrastructure amid competition from other AI agents have weighed on the stock in recent months.
The company said it expects to spend $190 billion in capital spending this calendar year, exceeding analysts’ expectations, due to rising costs of memory chips. Moreover, users of Copilot AI assistant rose in the quarter, but it is still small compared to the company’s overall user base.
On balance, the results appear to be best mixed. In other words, it may not be enough to propel the stock higher just yet. This means that while the broader recovery trajectory remains intact, given the sharp rebound in recent weeks,
Microsoft shares could retreat in the near term.
Technical Analysis on Microsoft Corporation (NASDAQ: MSFT)
MSFT (Daily):
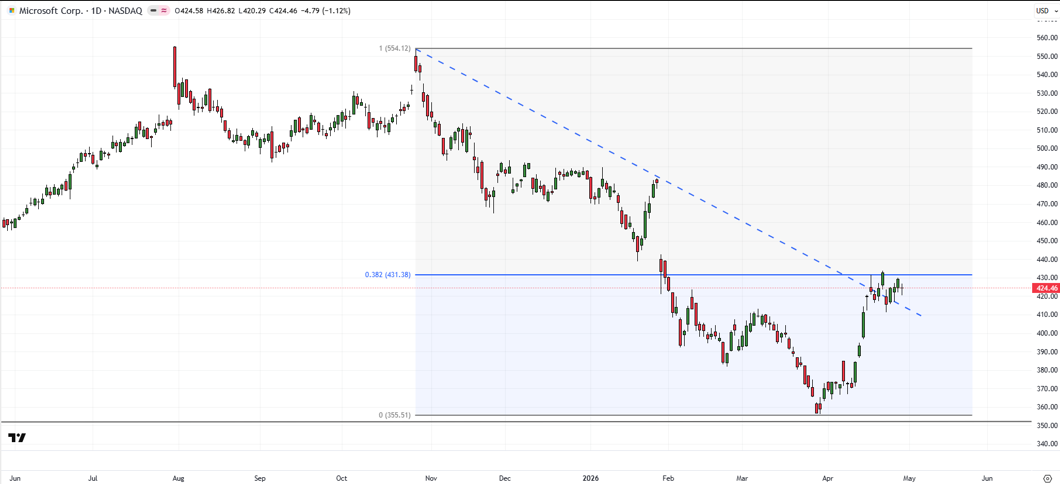
Microsoft shares are testing key converged resistance – the 38.2% retracement of the xxx-xx fall, roughly around a downtrend line from late 2025.
Some consolidation/minor retreat wouldn’t be surprising given the recent jump.
MSFT (Weekly):
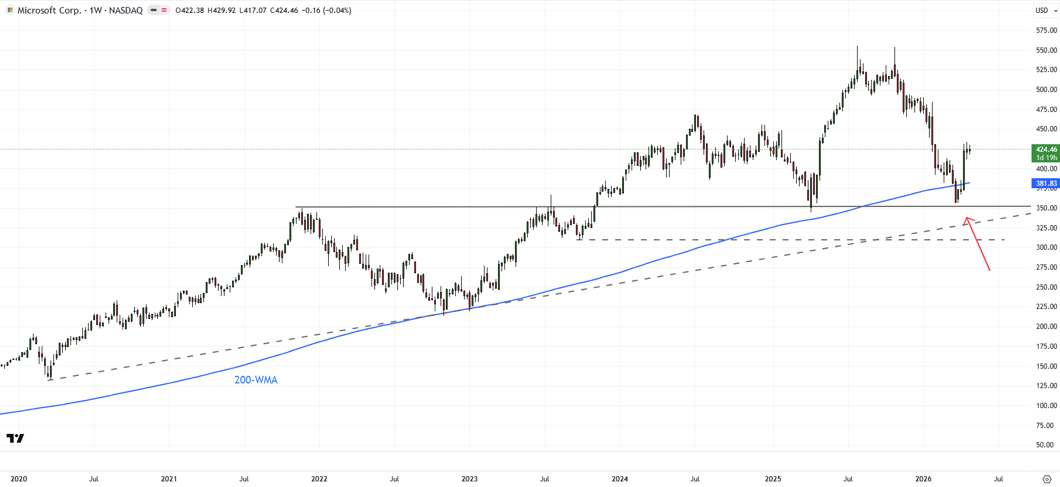
Zooming out a bit, Microsoft has rebounded from major converged support – the April 2025 low, the November 2021 high, and the 200-week moving average.
The subsequent break above minor resistance at the early-March high of 413 confirms that the downward pressure has faded for now. Any break above 430 could point to a move toward 455 (the 50% retracement). The stock would need to break above the December highs of 490-495 for the uptrend to resume.
On the downside, only a break below the March low of 356 would accentuate downside risks.
MSFT (Weekly):
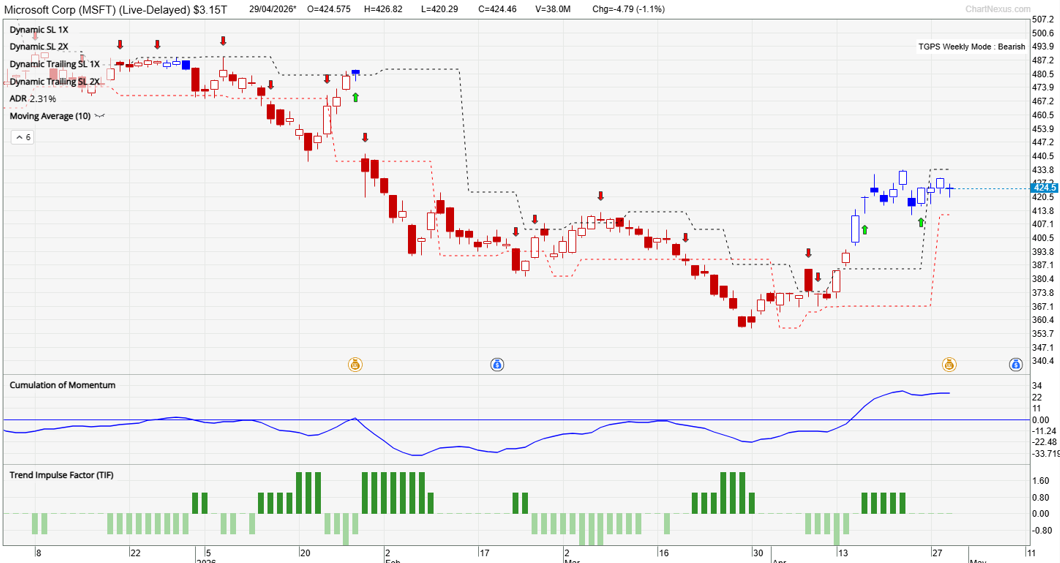
TradersGPS Signal
On our TradersGPS (TGPS) system, tentative signs of a change in trend are emerging.
On the Daily timeframe, the candle colour has turned Blue for the first time since November 2025 – in hindsight, the system captured the downtrend smartly. Blue candles indicate the stock’s trend is up. Red candles indicate the trend is down.
To be fair, on the Weekly timeframe, the system candle colour remains Red. However, the downward pressure appears to be abating, as per the system.
In terms of strategy, the break above resistance, coupled with the Blue coloured candles on the Daily chart, supports the case for a gradual but fragile recovery.
If I were long the stock, I would continue to hold the stock (see previous update “Microsoft: May Be Time to be Constructive,” dated April 1). However, if I hadn’t had a chance to capitalize on the recent dip, then I would wait for the Weekly candle colour to change to Blue before taking a leap at the stock.
FAQ
Why is Microsoft stock recovering?
The rebound is driven by oversold conditions, easing geopolitical risks, and strong Q1 earnings performance.
What are key resistance levels for MSFT?
Key resistance levels are 430, followed by 455, and the major zone at 490–495.
What is the downside risk for Microsoft stock?
A break below the March low of 356 could signal renewed downside pressure.
What does TradersGPS indicate?
The system has turned bullish on the daily chart but remains bearish on the weekly timeframe.