About the Security (HKEX: 700)
Tencent Holdings is a world-leading internet and technology company that develops innovative products and services, including video games, cloud computing, advertising, artificial intelligence (AI), and digital content.
It operates instant messengers Tencent QQ and WeChat, along with the news site QQ.com.
Stock background:
Tencent Holdings reported its second-quarter earnings earlier this week, positing 11% on-year growth in revenue and beating estimates. The results failed to impress investors as net profit fell short of expectations amid massive investments in artificial intelligence (AI).
Investors worry that surging investments in AI investments could lead to slower profit growth. The stock is down 35% from its 2025 peak of 680. The key question now is — how much of it is in the price? This can be tricky, especially if assessed subjectively.
Looking at similar episodes can provide some clues. Although this is not an apples-to-apples comparison, Microsoft’s stock lost about 35% from its peak on similar concerns. However, the structural story supporting Microsoft has kept long-term investors’ belief in the company, triggering a handsome rebound in the stock recently.
Microsoft and other similar stocks are not a template, but do reiterate that the structural story can, over time, overshadow cyclical weaknesses.
Tencent Holdings (Weekly):
Technical Analysis on Tencent Holdings (HKSE: 700)
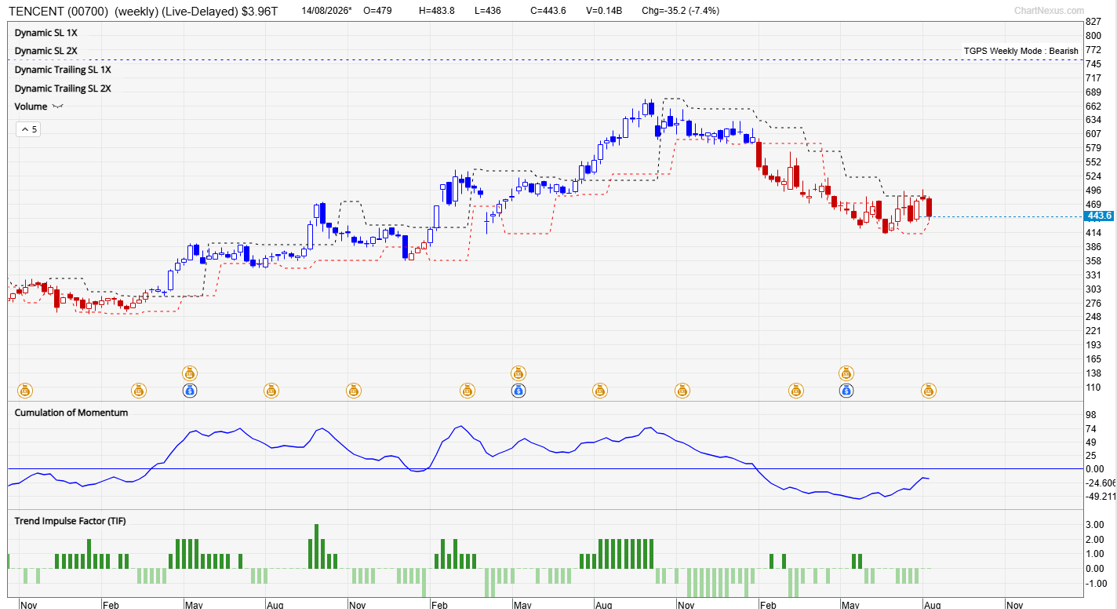
Our proprietary system TradersGPS (TGPS) remains bearish on the stock. The candle colour turned Red at the start of 2026, warning of a reversal of the uptrend.
As per our system, Blue candles indicate the stock’s trend is up. Red candles indicate the trend is down. In hindsight, the system was smart enough to point out the reversal of the bullish trend.
As the appended chart shows, signals from the system that occur on the weekly chart have a multi-week holding period. This makes it suitable for passive investors who are looking for systematic ways to invest.
For instance, the bullish signal that occurred in early 2024 lasted until early 2026. The current episode of Red coloured candles has been on since February, and the color hasn’t changed yet.
Tencent Holdings (Weekly):
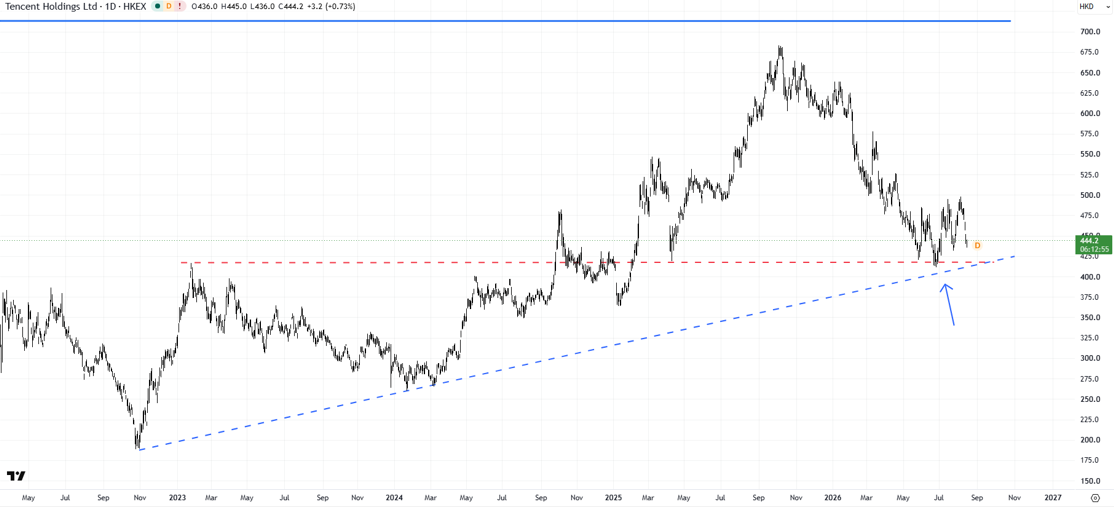
On technical charts, Tencent shares are holding above major support at 400-420 (the January 2023 high, coinciding with an uptrend line from October 2022). This support is crucial for the medium-term trend to remain intact.
Repeated failed attempts to clear immediate resistance at the June high of 485 do expose downside risks toward 400-420 or even lower. Any break below 400-420 could open the door initially toward the January 2025 low of 365, with subsequent support at the January 2024 low of 260.
Hence, it is vital for Tencent shares to rise decisively above the June high of 485. Such a break would confirm that the immediate downward pressure had eased, and raise the odds that the worst was over for Tencent shares.
A rebound could pave the way initially toward the March high of 578, possibly toward the January high of 638.
Trading Strategy:
In the last update, “Tencent: Tentative Signs of a Base,” released July 23, 2026, I mentioned I would be inclined to dollar cost average below 450. It is currently under 450, and the hypothetical long idea has kicked in. As previously highlighted, at the current price, the stock is 35% below last year’s peak of 680.
Granted, there is a sign of reversal, at least yet, and the stock could go lower. While there is a fair bit of risk involved, I wouldn’t mind holding a stock with a structurally bullish backdrop and oversold conditions. However, as always, I could be wrong!