Google has agreed to pay for 890 megawatts of new nuclear power from Constellation Energy, with the first of it expected by 2028.
Most investors are watching how much electricity AI will need. For your positions, the more useful question is how slowly new supply arrives, and which stocks get paid while the grid catches up.
What’s happening?
The first development is the deal itself, signed on 6 October. Google agreed to buy 890 megawatts of new nuclear capacity from Constellation over 20 years.
Constellation will spend more than $4.3 billion upgrading 11 of its nuclear units in Illinois, Pennsylvania, and New Jersey. Its shares rose by double digits that day, and other power producers such as Vistra rose with it.
The second development concerns the grid these plants are connected to. PJM is the largest power grid in the US, covering 13 states.
PJM pays power plants years in advance to be ready when they are needed. It does this through a capacity auction, where plants bid, and the clearing price sets what they are paid.
In July, the auction for 2028/2029 cleared at the maximum price allowed, $325 per megawatt-day. Even at that price, it came up 6,831 megawatts short of what PJM needs.
PJM then planned an emergency purchase to fill the gap, but on 29 September, FERC suspended it for five months. FERC is the Federal Energy Regulatory Commission, the US regulator for power grids, and one of its main objections was over who should pay.
On the demand side, Gartner, the research firm, expects data centres to use about 26% more electricity in 2026 than in 2025. In June, one of its analysts said AI capacity is now limited by how much power is available.
That gap between rising demand and slow new supply is where power stocks come in.
Why AI makes power a bigger business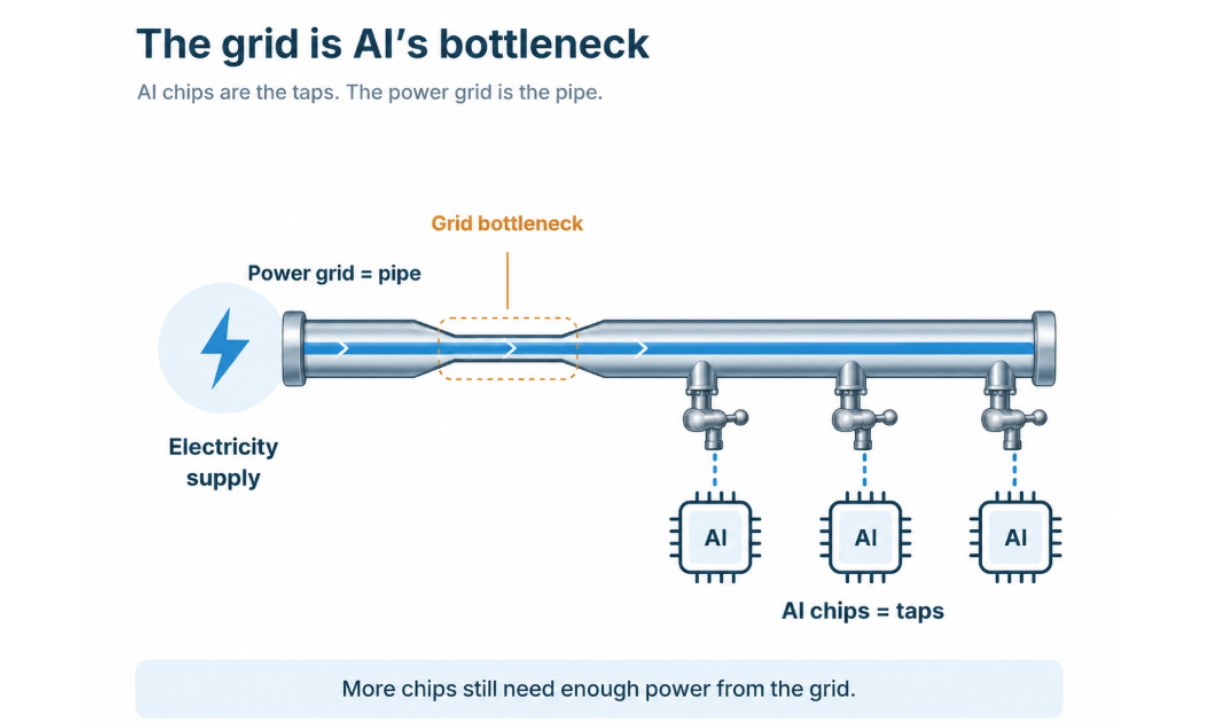
Think of a house where everyone suddenly wants more water. You can fit as many new taps as you like, but if the pipe from the street stays the same size, nobody gets more water.
In this picture, AI chips are the taps, and the grid is the pipe, which is currently the part slowing everything down.
When the pipe is the bottleneck, the companies that can supply it tend to get paid, and that happens in two ways.
The first is through long contracts. The Google deal gives Constellation a buyer for its upgraded capacity for the next 20 years.
The second is through equipment orders, and GE Vernova is one example. It makes gas turbines and grid equipment, and reported a backlog of $176 billion in July.
A backlog is work that a company has been ordered to deliver but has not delivered yet. GE Vernova’s data centre orders passed $5 billion for the year by the end of June, more than double its 2025 total.
Why this is more complicated than a normal growth story
Even after its jump on 6 October, Constellation’s shares were still down about 15% for 2026. GE Vernova, by contrast, was up about 50% for the year by mid-August.
Both companies are tied to the same AI theme, but their charts have moved in opposite directions this year.
Part of the explanation may be that electricity is not sold like a normal product. PJM’s auction cleared at its price cap, so the shortage could not show up fully in what power sellers are paid.
Power bills are also political. When households pay more, regulators and politicians tend to push back on who covers the cost of new supply.
Interest rates are also rising again, with the Fed, America’s central bank, raising its policy rate to a range of 3.75% to 4% on 16 September. Higher rates make it more expensive for power companies and utilities to borrow for new plants and grid upgrades.
So the demand itself is not really in doubt. The open question is who gets paid for meeting it, and when.
Two mistakes to avoid
Don’t buy the story instead of the chart
The AI power story is easy to believe, and every new deal makes it sound more certain. Constellation’s year shows that a strong story can sit on top of a falling share price.
Don’t chase one day’s headline
One deal moved a whole group of power stocks in a single session, but one session does not change the weekly trend by itself. Momentum still has to confirm on your rules before there is an entry.
Sort power stocks into three groups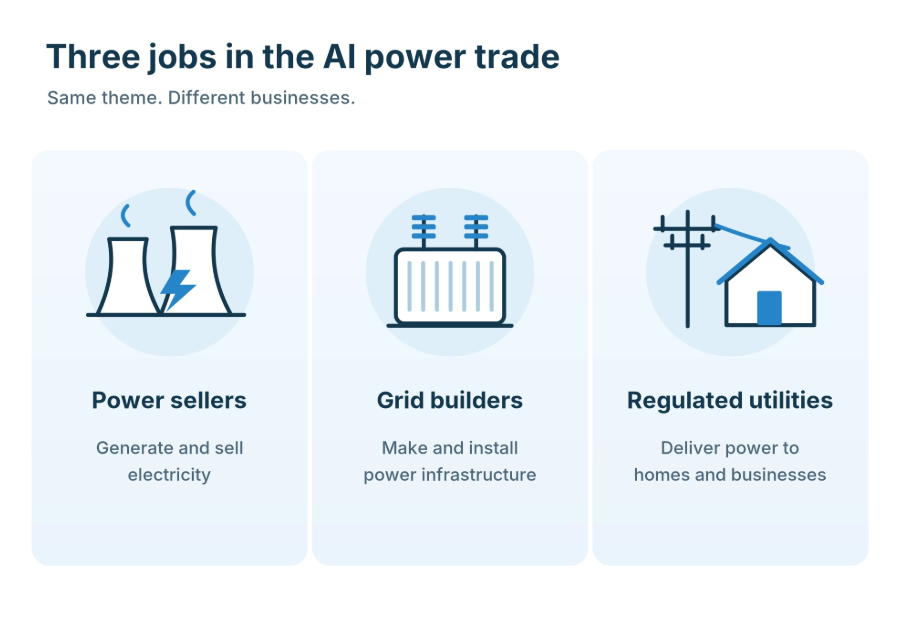
The same news hits these companies in different ways, so sort them before you read anything into a headline.
Power sellers
These companies own power plants and sell the electricity, either in the open market or under long contracts, as Constellation and Vistra do.
Their earnings move with power prices, auction results, and regulators’ decisions, which leaves them the most exposed of the three groups to price caps and the politics of power bills.
Grid builders
These companies make or install the turbines, transformers, and transmission lines that the grid is built from. Examples include GE Vernova, Eaton and Quanta Services.
They get paid when orders come in, years before any new power flows. Their risk is different: a slowdown in orders would hurt them more than a price cap.
Regulated utilities
These companies own the wires that run to homes and businesses. Regulators set the return they are allowed to earn on what they build.
They borrow heavily to build, so they tend to be sensitive to interest rates. They are also first in line when politicians ask who should pay.
Check each stock’s relative strength in your screener, then compare it with its own sector fund, such as XLU for utilities, and with the S&P 500. A stock that is weaker than its own sector is not being carried by the theme.
Let the chart make the decision
You don’t need a view on power prices, PJM, or the Fed to manage these stocks, because the weekly chart answers the trading question for you.
If the weekly trend is still up, the market has not yet treated these worries as serious enough to change it, and momentum still has to confirm before the rules give an entry.
If the weekly trend has broken, the story no longer matters for the trade. Exit by your rules, or check that your stop is where it should be.
A signal is a point where the rules say a defined risk is worth taking. Some signals work, and some don’t, and the rules stay the same either way.
As an example, this is how the SMT Position Weekly and Position Daily setups read Constellation’s chart.
Constellation Energy Corp (Position Weekly)
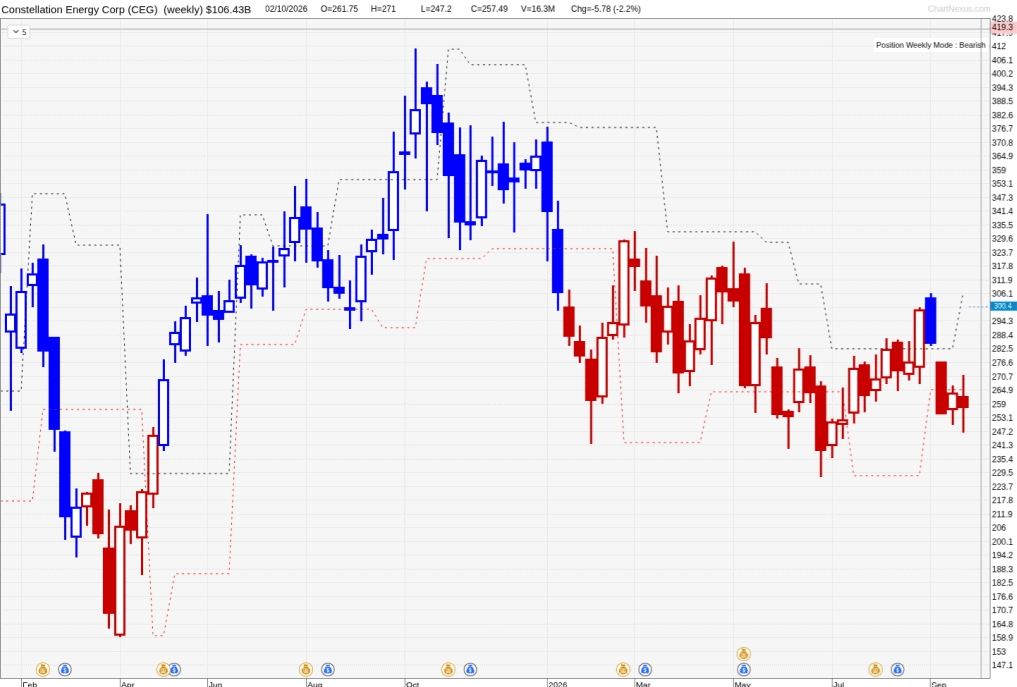
The Position Weekly candle changed from red to blue in the week ending 11 September 2026. Following the rules, the buy-stop sat slightly above that week’s high of 306, and the system set the stop near 265.
The buy-stop was never filled, because in the following week, ending 18 September, the candle turned red again and closed at 255, down about 11%, without reaching the buy-stop.
No trade was taken, so there was no loss, and the system went back to waiting for the next red-to-blue change.
None of this needed a view on the Google deal or PJM. The rules set the entry, the stop, and the exit, and in this case, they also showed when not to enter.
Constellation Energy Corp (Position Daily)
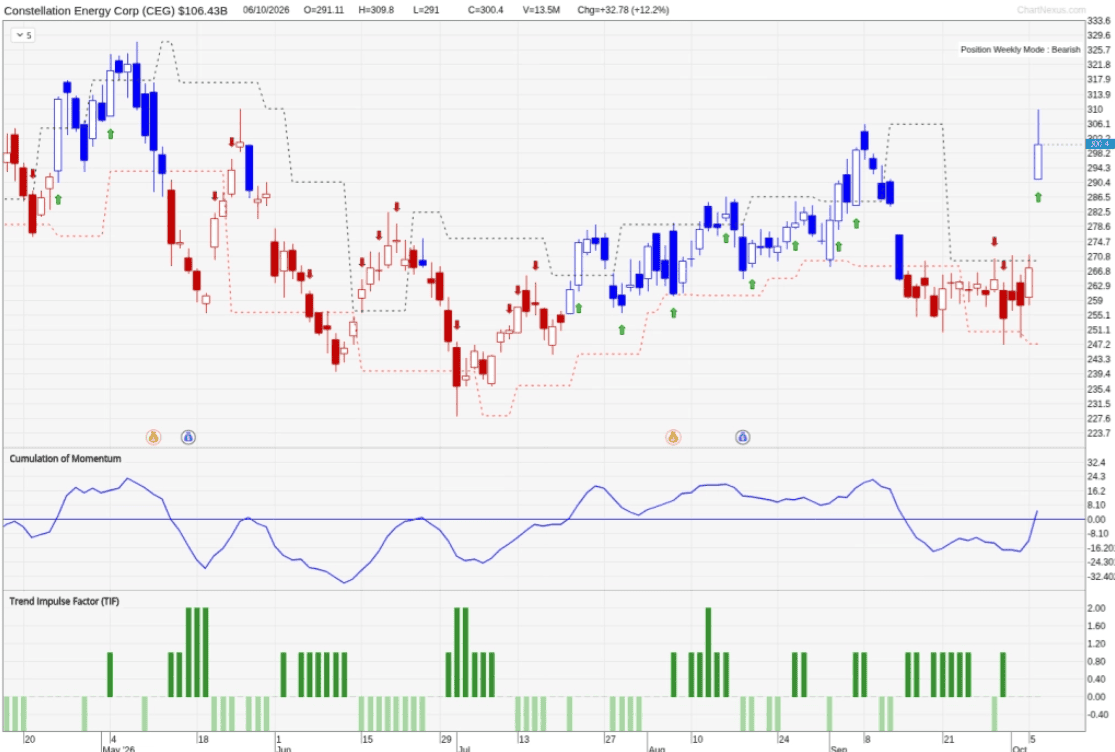
On the daily chart, a Position Daily buy arrow printed on 6 October 2026, after a 12% jump to close at 300. That puts the buy-stop slightly above 310, with the system stop at around 247.
It isn’t a full ATM setup yet, because TIF wasn’t positive, and Mode is still Bearish. By the rules, we wait for the 2nd or 3rd ATM setup rather than chase the jump, and the buy-stop hasn’t triggered either.
Not every daily signal works, and not every arrow is a trade. When one fails, they stop the loss, and nothing about the rules changes.
What to watch between now and the December capacity auction
The Fed meeting on 27 and 28 October
The decision is due at 2:00 a.m. Singapore time on Thursday, 29 October. Another hike could add pressure on power stocks and utilities, while a pause could ease it.
Constellation’s quarterly results
Constellation is expected to report third-quarter results around 6 November 2026. Signs that deals like Google’s are adding to earnings could support the case, while a cautious outlook could bring the worries about capped prices and power bills back into focus.
PJM’s December capacity auction
Another result at the price cap would keep a ceiling on what power sellers earn from capacity, while a result below the cap could suggest new supply is starting to catch up.
Each of these matters only if it changes the weekly trend, and the chart will show you when it does.
You don’t need an opinion on AI’s power problem when your trading rules already tell you what to do.
–
If this article helped you understand the market, the next step is seeing how to put that knowledge to work.
Watch my 3-step trading process LIVE: find promising stocks, plan when to buy and sell, and decide how much to risk before placing a trade.
It’s the same approach I’ve used to trade systematically and generate monthly returns over the past five years. Click the banner below to learn more.