
About the Security (NYSE: BABA)
Alibaba Group Holding Limited, branded as Alibaba, is a Chinese multinational technology company engaged in e-commerce, retail, internet, and technology. The company provides consumer-to-consumer, business-to-consumer, and business-to-business sales services via Chinese and global marketplaces.
Stock background:
Alibaba shares jumped briefly this week after the company unveiled a new AI chip that could be three times faster than its predecessor. Moreover, the company is also reported to expand data centers in Europe and the Middle East, Malaysia, and Hong Kong, amongst several other countries, to boost its ability to provide localized services.
The broader the narrative of Alibaba has shifted from an e-commerce company to cloud computing and artificial intelligence. Some analysts estimate that the retail e-commerce platform is still the company’s major cash-flow segment. However, cloud computing is growing strongly, suggesting that diversification could be paying off.
Having said that, some of the optimism has been overshadowed by the company’s massive share placement in August to fund its AI plans, raising concerns about equity dilution. Quite a few analysts remain bullish on the stock, projecting higher AI cloud revenue in the coming years.
BABA (Weekly):
Technical Analysis on Alibaba (NYSE: BABA)
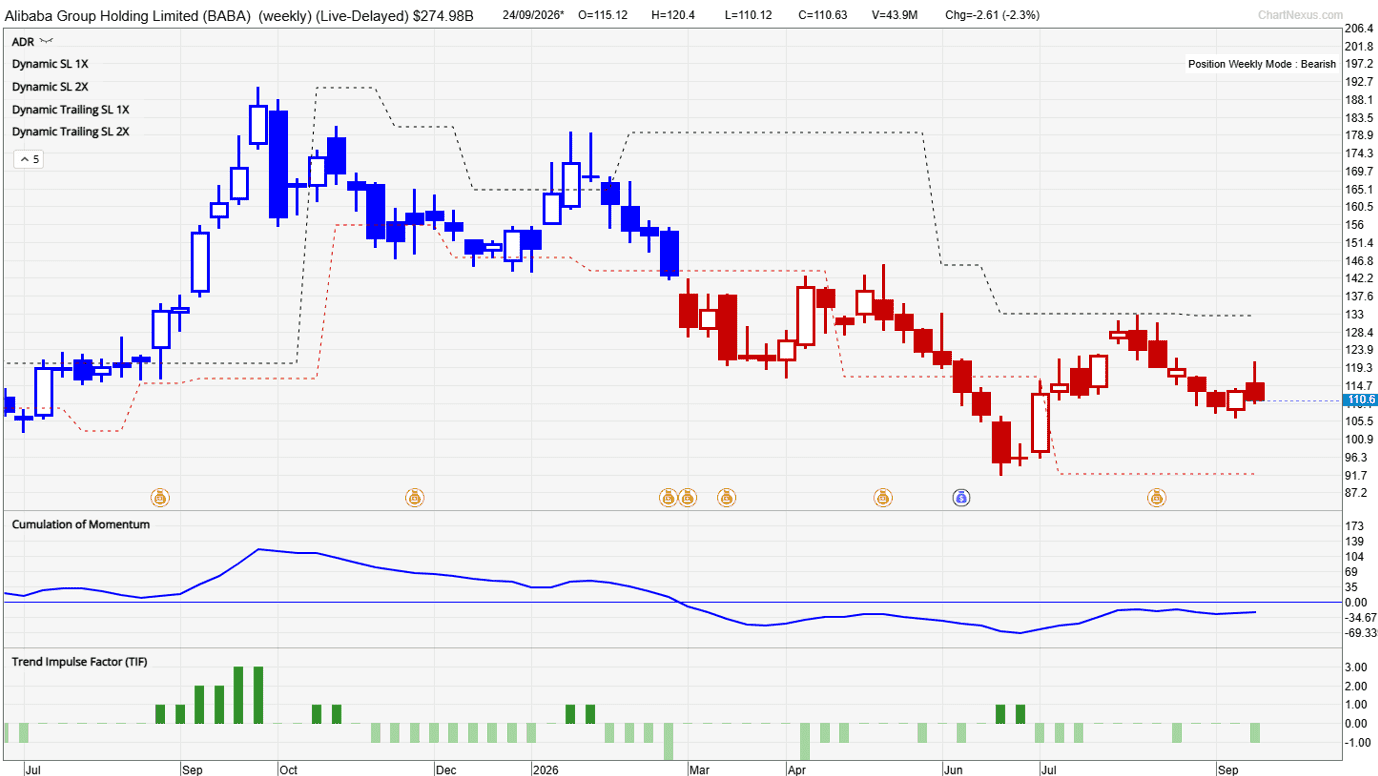
Our proprietary TradersGPS (TGPS) system has been spot on in calling the weakness. Back in March, the candle color turned Red on the weekly chart. For those who are new to our system, Blue candles indicate the stock’s trend is up. Red candles indicate the trend is down.
The system turned bearish after the stock fell below key support at the end of 2025, with a low of 145. This is especially noteworthy. When a support is broken, at times it can be tough to identify if the support break is genuine or a false one. So, in a way, the system has inbuilt characteristics that can identify in real time whether a support break is clean.
Not only that, the system is based on trend-following, which enables us to participate in a trend the moment there are signs of the emergence of a sustained trend. This can be particularly useful for passive investors.
BABA (Weekly):
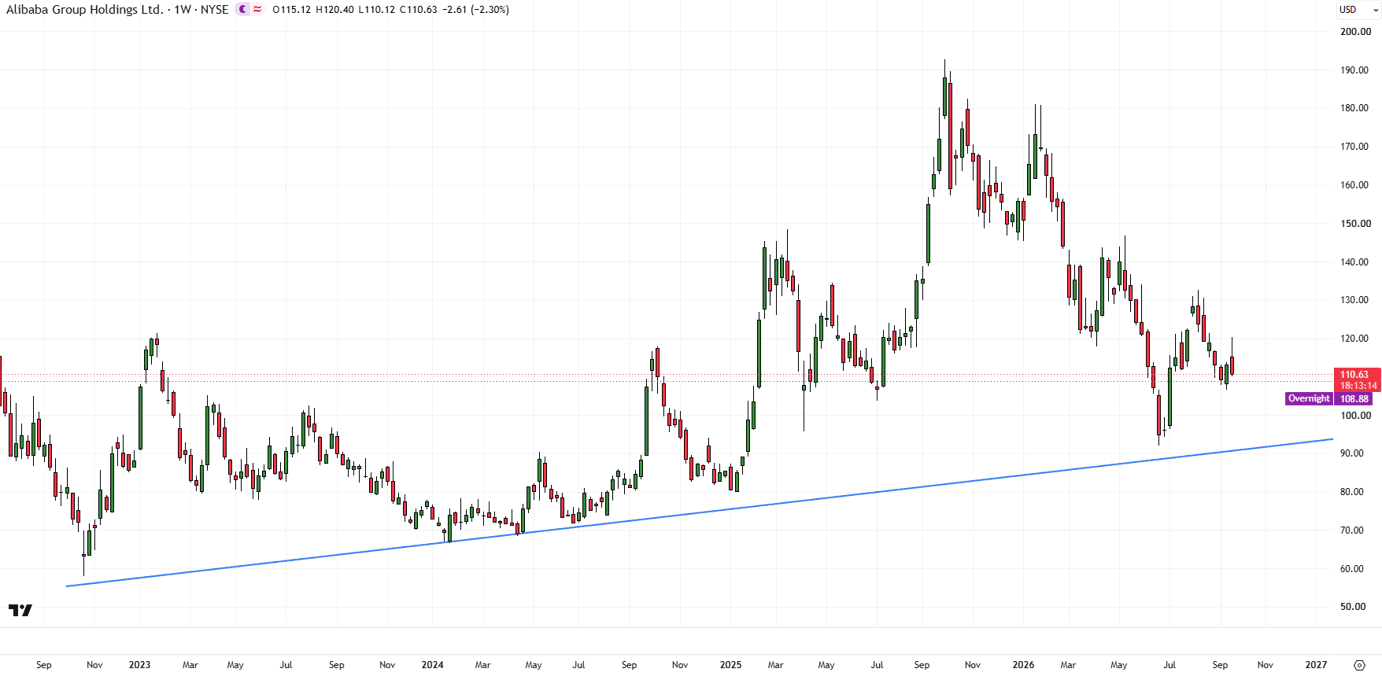
On technical charts, BABA has been holding above a significant support area around 88-90, which includes an uptrend line from 2022 and the lower edge of a pitchfork channel from last year.
However, the recovery since xx appears to be feeble, and the rebound appears to be losing steam. Two scenarios can emerge from here. First, last week’s low was a secondary low, and the stock is in the process of establishing a higher low for another ascent. Second, the stock falls back toward the June low, risking a break of the converged support at 88-90.
The bias remains toward the former scenario. However, a break above the August high of 132 is needed to confirm that the downward pressure has faded. Any break above subsequent resistance at the May 2026 high of 146 could raise the odds of another leg higher, toward the 2025 high of 192.
Trading Strategy:
The hypothetical longs highlighted in the previous update kicked in mid-July around 110. Subsequently, the stock rebounded to 132 before retracing back. I would prefer to stick with the long strategy. However, cautious investors might want to wait for the candle colour to turn Blue before considering longs.
Given the deep retracement since August, I would be on watch of my stop because, as always, I could be wrong!