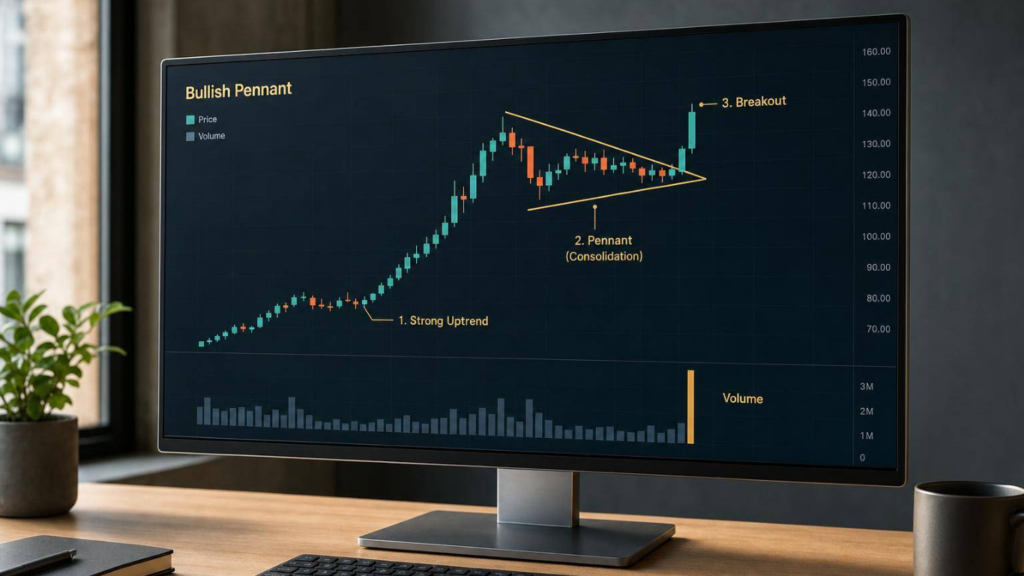
If I had to cut this trading guide down to one rule, it’s this: I only treat a flag or pennant as tradable when there’s a sharp prior move, a short pause, and a breakout close with volume.
That’s the whole setup in plain terms. If any one part is missing, I treat it with care.
Here’s the short version:
- Flags and pennants are continuation patterns
- They form after a strong move up or down
- The market then pauses in a tight range
- I wait for a candle close outside the pattern
- I want volume to fall during the pause and pick up on the break
- I place my stop outside the other side of the pattern
- I use the flagpole height as a rough target, not a promise
A few numbers help keep this grounded. Many traders look for at least 3 clear stages in the setup: impulse, consolidation, breakout. And if the pullback eats up too much of the first move, the pattern often loses shape and becomes less clean.
What matters most is not the label. It’s the sequence.
If you’re trading SGX counters after earnings, guidance, or market-moving news, this pattern can show up when price surges, stalls, then tries to continue. In that case, I focus less on guessing and more on a short checklist: trend, shape, volume, close, stop.
| Check | What I look for |
|---|---|
| Prior move | Sharp and one-way, not messy |
| Pattern shape | Flag = parallel lines; pennant = converging lines |
| Volume | Lower in consolidation, higher on breakout |
| Entry | Candle close beyond the boundary |
| Risk | Stop beyond the far side of the pattern |
| Target | Flagpole projected from breakout |
My takeaway: these patterns are simple on paper, but they only make sense when I trade the confirmed break, not the story in my head.
That’s the lens I’d use for the rest of this guide.
Flag and Pennant Trading Guide
A flag shows up when price pauses inside a short channel that leans against the move that came before it. After a strong rally, the flag usually tilts a little lower. After a hard drop, it often tilts a little higher. A pennant looks different. Instead of two parallel lines, its trendlines move towards each other and form a small triangle. Both are continuation patterns. The next step is to use trendlines and the trend that came before the pause to tell them apart.
Flag vs Pennant: Shape, Trendlines, and Consolidation
The easiest way to separate the two is to look at the trendlines. A flag has two parallel lines: one acts as support, the other as resistance, and price moves between them during consolidation. A pennant uses two lines that angle inwards, so price gets squeezed into a tighter range as the pattern develops.
| Feature | Flag | Pennant |
|---|---|---|
| Shape | Rectangular / parallel channel | Small symmetrical triangle |
| Trendlines | Parallel support and resistance | Converging trendlines |
| Consolidation | Slopes against the prior trend | Tightens toward an apex |
Deep retracements make the setup less reliable. These structural differences start to matter once the breakout begins to take shape.
Bullish and Bearish Versions
Both patterns can be bullish or bearish. A bullish flag or pennant appears after a sharp move up and marks a short pause before price continues higher. A bearish flag or pennant appears after a sharp move down and reflects a pause before the next move lower. The breakout usually follows the earlier trend, not the shape of the consolidation alone. Trend context and volume help confirm the setup.
Pattern Structure, Trend Context, and Volume Clues
Shape shows you the pattern. Trend context and volume show whether it’s worth trading.
The Flagpole, Consolidation, and Breakout Sequence
A valid setup has three parts: a strong flagpole, a short consolidation, and a breakout in the same direction.
The flagpole is the sharp, impulsive move that kicks off the pattern. It should show clear directional momentum, not a choppy sideways range. This is where trend context comes in. You need a prior impulse, not a flat market going nowhere.
The consolidation comes next. This pause should stay short compared with the size of the flagpole. If the consolidation drags on for too long, the setup starts to lose strength.
The breakout finishes the pattern. Price moves beyond the consolidation boundary – above resistance in a bullish setup, below support in a bearish one – and the earlier trend continues.
Once the structure is in place, volume helps you judge whether the pause is healthy or if the setup is starting to fall apart.
Volume Contraction and Expansion
Volume tends to tell the same story through all three phases. During the flagpole, volume is often high because strong participation is driving the sharp move. When price shifts into consolidation, volume usually drops. That drop suggests a pause in the trend, not a full reversal. At the breakout, volume should pick up again, showing that market participation is back behind the move.
Volume is the last check on price strength.
A candle close beyond the boundary matters more than a brief intraday wick. Once the breakout is confirmed, your entry, stop loss, and target levels can be mapped from that boundary.
| Phase | Volume Behaviour | What It Signals |
|---|---|---|
| Flagpole | High | Strong momentum and market participation |
| Consolidation | Declining | Temporary pause in trend, not a reversal |
| Breakout | Expanding | Continuation move with real participation |
Master Systematic Trading with Collin Seow
Learn proven trading strategies, improve your market timing, and achieve financial success with our expert-led courses and resources.
sbb-itb-466c9b0
How to Trade Flag and Pennant Breakouts
Once the breakout is clear, trade only the confirmed move. That sounds simple, but this is where many traders get pulled in too early.
Entry Triggers and Confirmed Breakout
Wait for a close beyond the pattern boundary, not just an intraday push through it. A quick move above resistance or below support can look convincing in the moment, then fade by the close.
For a bullish setup, you want a candle close above the resistance trendline. For a bearish setup, you want a candle close below the support trendline.
Volume matters too. The close should be backed by higher-than-usual volume. That helps show the breakout has actual participation behind it, not just a short-lived price jump. Once that confirmation is in place, sort out your risk before the move runs further.
Stop Loss and Target Placement
Place the stop loss just outside the opposite side of the pattern. For a bullish flag or pennant, that means just below support. For a bearish setup, it goes just above resistance.
For the target, project the flagpole height from the breakout point. This gives you a price target based on the size of the move that led into the pattern, instead of picking a random level.
The same rules apply on both sides. Bullish and bearish setups use the same logic. Only the direction changes.
Trade Plan Summary for Bullish and Bearish Setups
Before you enter, define your entry, stop, and target.
| Trade Component | Bullish Flag / Pennant | Bearish Flag / Pennant |
|---|---|---|
| Entry Trigger | Candle close above resistance trendline | Candle close below support trendline |
| Volume Filter | Volume spike on upward breakout | Volume spike on downward breakout |
| Stop Loss | Just below support | Just above resistance |
| Profit Target | Flagpole height projected upward from breakout | Flagpole height projected downward from breakout |
| Invalidation Signal | Breakback into pattern | Breakback into pattern |
Next, avoid the mistakes that weaken valid flag and pennant trades.
Common Mistakes and Key Takeaways
Mistakes That Reduce Pattern Reliability
A valid flag or pennant can still fail if traders don’t stick to the rules.
The most common mistake is trading a flag or pennant without a strong prior trend. These are continuation patterns. If there isn’t a clear move before the consolidation, the setup is much weaker.
Another common issue is misreading the shape. If you label the pattern wrongly, you’ll draw the wrong boundaries and often place your stop in the wrong spot.
Three execution mistakes do the most damage:
- Enter only after a candle closes beyond the boundary
- Ignore breakouts on thin volume
- Don’t place stops inside the pattern
Even a clean intraday setup tends to fail more often when the higher timeframe is moving sideways or pushing against your trade.
Key Takeaways for Disciplined Execution
Use the same checklist for every setup.
Start with the higher-timeframe trend, then move to the daily or intraday chart for the setup and entry. That keeps your trade in line with the bigger picture before you put money at risk.
Volume matters here. It should contract during consolidation and then expand on the breakout. That order helps confirm the pattern is forming the way it should.
Treat the measured move – flagpole height projected from the breakout – as a planning reference, not a guarantee. Set your stop and target before entry.
FAQs
How deep can the pullback be?
A healthy pullback into a key zone will often retrace 38.2% to 61.8% before the trend continues. For a breakout retest, watch if price closes back inside the pattern within 0.5 to 1.0 ATR.
If the pullback remains shallow and support holds, that’s usually just normal consolidation. But if price closes below the breakout level on equal or higher volume, the move is more likely a failed breakout.
Which timeframe works best?
The best timeframe depends on how you trade. For many part-time traders in Singapore, a Weekly, Daily, and 4-hour mix works well. It helps cut out market noise and gives you a cleaner read on the trend.
A simple way to use it: look at the higher timeframe for direction, then use the lower timeframe to plan your entry.
Here’s how that often plays out:
- Position traders usually focus on Weekly and Daily charts
- Swing traders often use Daily and 4-hour charts
- Day traders tend to watch 1-hour and 15-minute charts
Think of it like using a map before picking a street. The higher timeframe shows the bigger picture. The lower one helps you decide where to step in.
What if volume does not confirm?
If volume doesn’t back up a breakout, the move may not have much support from the market. That usually means a higher chance the breakout fails. So it’s smart to treat an unconfirmed move with caution. Sometimes these breakouts are false signals. Other times, they’re just stop-loss hunts.
If volume stays around the recent average, or slips below it, that’s a red flag. In that case, it may be better to sit on the sidelines, wait for a clear close beyond the level, or watch for a retest to see whether price can actually hold.