
The risk of a minor setback highlighted toward the end of last year is still pretty much in play.
The US Federal Reserve’s decision to hold rates at its meeting at the end of January, concerns regarding overvaluation in US equities, and unprecedented spending by major technology companies on AI seem to have triggered a reassessment of the outlook on equities.
Macro Backdrop: Fed Policy and Valuation Concerns
The Fed in January kept interest rates on hold, noting a solid expansion in economic activity, a slowdown in jobs growth, and elevated inflation. While the decision was in line with market expectations, the Fed’s optimistic economic outlook cast a doubt on the extent of future rate cuts.
A recent CNBC Fed Survey showed the market sees just two more quarter-point rate cuts this year, with no change in rates in 2027.
The forward 12-month P/E ratio for the S&P 500 is 22, well above the 5-year and 10-year averages, according to FactSet. Stretched AI valuations and the ongoing massive planned capex spending on AI make it difficult to assess winners Vs losers in the AI race.
Most recently, Meta, Microsoft, Amazon, and Google announced a jump in their AI spending this year, but the market reaction has been mixed at best. Furthermore, concerns about a sharp slowdown in the labour market after US employers announced the highest layoffs since the Great Financial Crisis.
S&P 500 (Weekly):
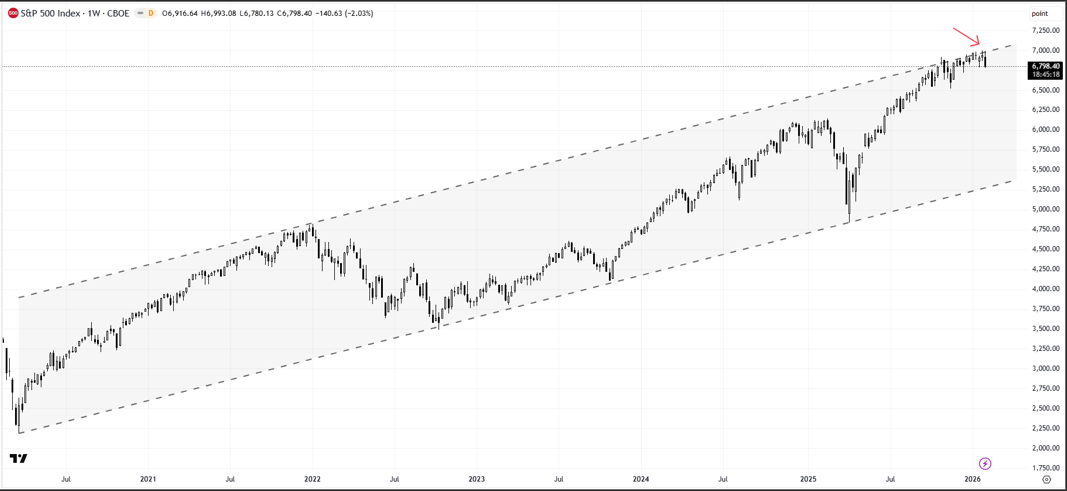
On technical charts, the S&P 500 index faces tough resistance on the upper edge of a rising channel from the Covid-19 low. Repeated attempts to clear the resistance at the upper edge, coupled with easing momentum, don’t bode well in the short term.
S&P 500 (Weekly):
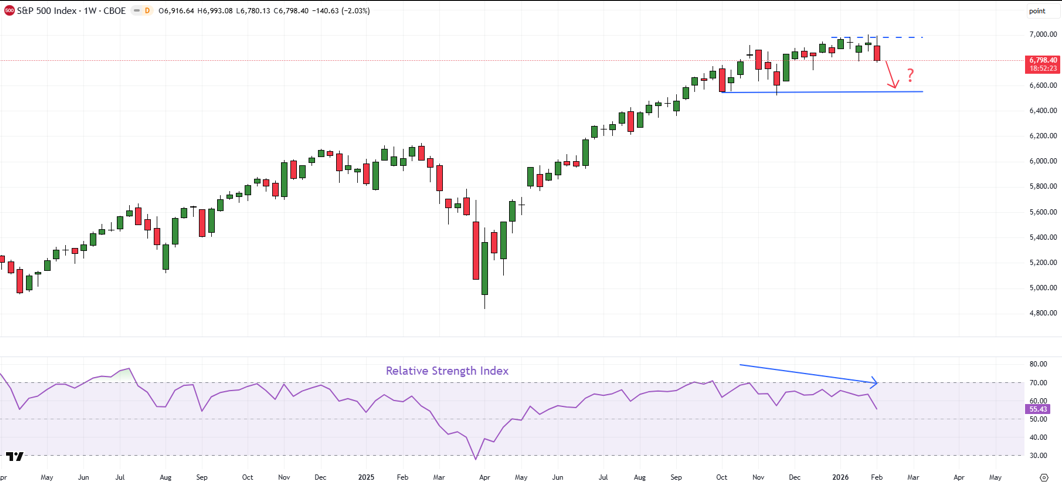
Negative momentum divergence on the weekly chart (higher highs in the index associated with declining momentum) is a sign that the rally is losing steam, at least in the short term.
A further retreat could push the index toward quite strong support at the October low of 6550. This could restrict the retreat, but any break below could pave the way toward the early-2025 high of 6150.
Unless the index cracks below the lower edge of the channel from 2020 (as highlighted in the weekly chart above), the long-term uptrend would remain intact. On the upside, a bullish break above the channel could pave the way initially toward the psychological 7000 mark, potentially 7500 in the coming months.
S&P 500 (Weekly):
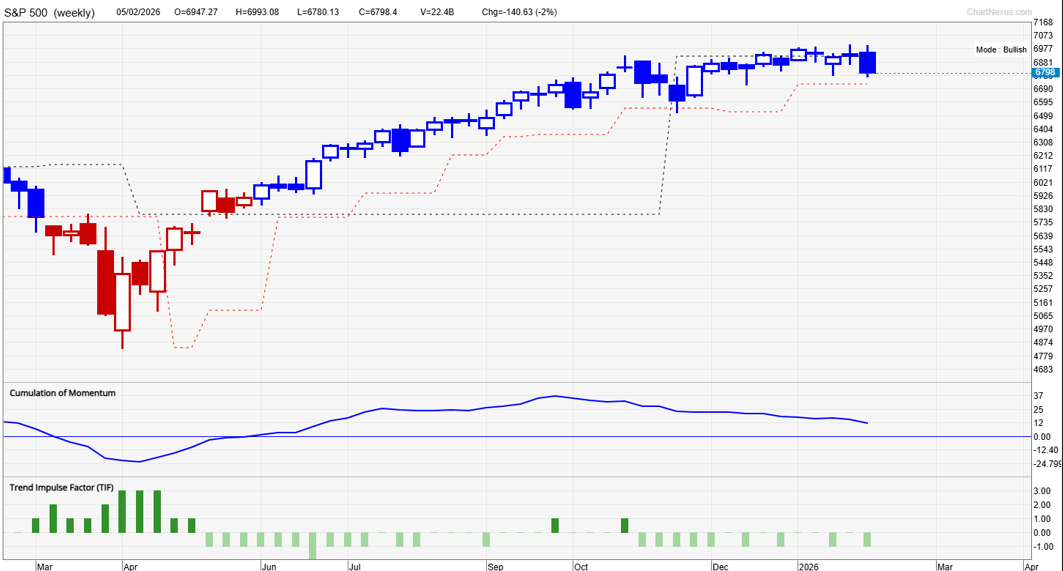
Despite the recent sideways price action, our proprietary system TradersGPS (TGPS) remains Bullish on the S&P 500 index on the weekly chart. Blue coloured candles indicate the trend is Bullish; Red coloured candles indicate the trend is Bearish.
As the chart shows, the weekly candle colour is not as sensitive to near-term gyrations in the market. Long-term trajectory continues to be bullish.
On the positive side, earnings growth continues to be a strong long-term driver. As of the end of January, 33% of the S&P 500 companies reported results, out of which 75% reported positive earnings surprise. For the last quarter of 2025, the estimated year-on-year earnings growth for the S&P 500 is around 11.9%, according to FactSet.
If it does turn out to be in double digits, it would mark the 5th consecutive quarter of double-digit earnings growth for the index. While earnings growth remains strong, the downside in equities is likely to be limited.
FAQ
Why is there a risk of a minor correction in US equities?
The Fed holding rates, elevated S&P 500 valuations, AI capex uncertainty, and weakening labour data have increased short-term reassessment risk.
Is the S&P 500 overvalued?
The forward 12-month P/E ratio is 22, above its 5-year and 10-year averages, indicating stretched valuations.
What are the key support levels?
Strong support lies near 6550, with further downside risk toward 6150 if broken.
Is the long-term trend still bullish?
Yes. TradersGPS remains Bullish on the weekly chart, and earnings growth continues to support the long-term trajectory.