Disclaimer
All articles are for education purposes only, and not to be taken as advice to buy/sell. Please do your own due diligence before committing to any trade or investments.
Plunging risky asset markets, heightened fear, and the rise in recession probabilities on rising fears of a global trade war has reminded investors of the not-so-distant Covid selloff. The S&P 500 index, the Nasdaq 100 index, and the Dow Jones index are down roughly 18%-25% from their respective peaks. However, if history is any guide, the decline in US equities is beginning to look stretched.
The S&P 500 index dropped 10% in just two days April 3 & April 4 after the US President Donald Trump announced new levies as part of a reciprocal tariff policy including a 10% tariff on almost every country, and much steeper levies on many. The selloff exacerbated after China announced it would impose a 34% tariff on all goods imported from US, raising fears of higher inflation and slower global economic growth.
In terms of the loss of market capitalization, on some estimates it was even larger than similar decline in March 2020. Risky currencies like AUD and NZD plummeted, oil prices fell sharply, and safe-haven currencies like JPY and CHF strengthened, while the flight to safety boosted US Treasuries. In terms of sector performance, the S&P 500 sector was the hardest hit, compared to its peers. Defensive sectors like Staples, Utilities, Healthcare outperformed cyclical sectors including Industrials, Energy, and Consumer Discretionary.
The worry is that US President Donald Trump may have ignited a global trade war that could push the world economy into recession. The CNN Fear & Greed Index is in Extreme Fear category, at just 4, and tad above the 0 threshold. The US Put/Call ratio hit the highest level since 2023 (suggesting investors were buying put options), while the VIX Index, the market’s expectations of volatility of the S&P 500 index options, surged to the highest level since August 2024. The International Monetary Fund’s chief Kristalina Georgieva has warned the tariffs represent a significant risk to the global economy. This was echoed by Federal Reserve Chair Jerome Powell remarks that US tariffs were larger than expected and will likely cause inflation to rise and growth to slow. The carnage in global markets prompted European Union leaders to urge calm in markets, calling for regional unity and composure in dealing with Trump tariffs.

Volatility could persist in the short term as investors watch for signs of trade negotiations or further retaliation and/or a proactive central banks’ response to soothe markets. Depending on the extent, any further retaliation by trading partners would risk an intense trade war. China and Canada announced retaliatory measures last week, while the European Union was reported to be readying for tariffs, according to media reports. On the other hand, the willingness of policymakers to get back to the table for negotiations would provide some comfort to investors. While countries decide the next course of action, emergency rate cuts by central banks, including the US Federal Reserve, could boost sentiment, at least temporarily. However, those hopes were squashed after Powell suggested last week that the central bank was in no hurry to cut rates.
As far as the market trend is concerned, our proprietary TradersGPS system still shows the broader trend is down – since December the system has repeated flashed red, warning of a reversal of the uptrend. As the two charts appended show, the colour of the candles remain Red on the daily and Weekly, suggesting the trend remains Bearish.
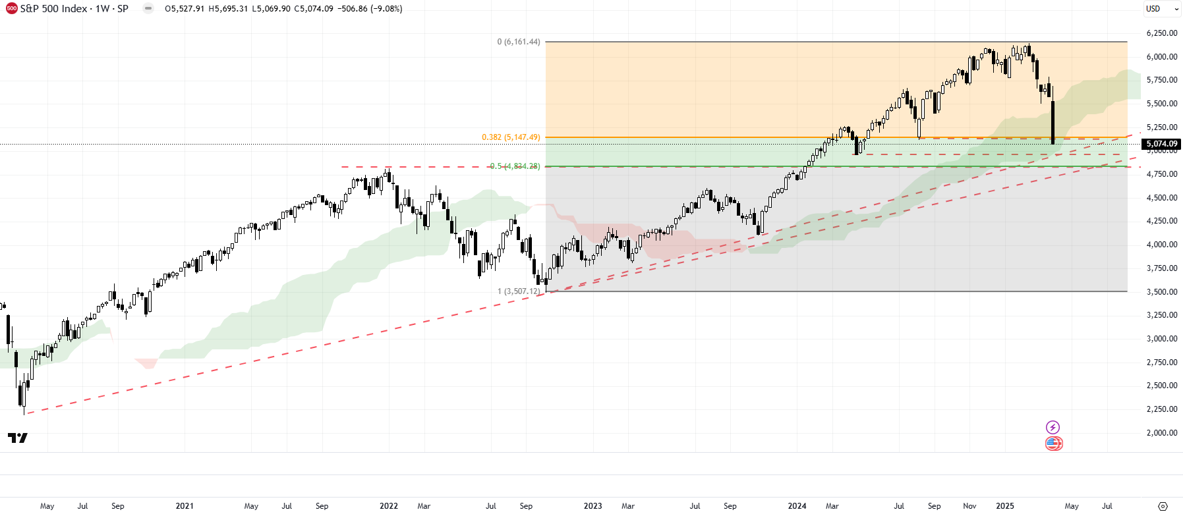
Having said that, a short-term rebound can’t be ruled out due to stretched sentiment and deeply oversold conditions for three reasons. Firstly, the S&P 500 index is approaching quite strong converged support area of around 4820-4950, including the end-2022 high, and uptrend line from late 2022, and the April 2024 low. The 14-week Relative Strength Index has hit the lowest level since the March 2020 selloff. A reading below 30 indicates oversold conditions.
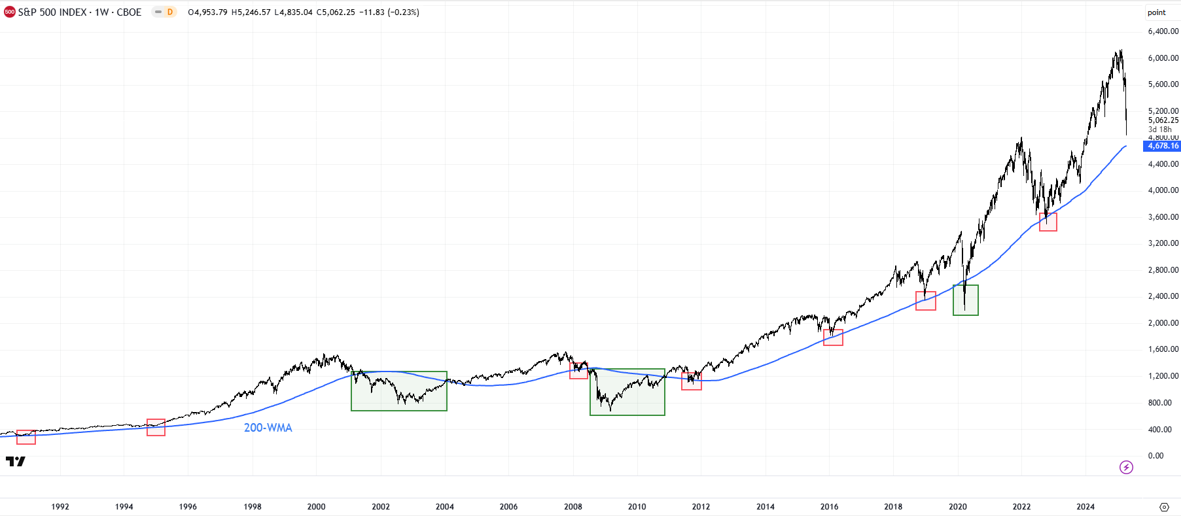
Secondly, the index is approaching the 200-week moving average (last at 4678). As the appended chart shows, 7 out of 10 times the index has rebounded from the long-term moving average. Thirdly, the percentage number of members in the S&P 500 index below their respective 200-day moving average was last at 19. As the chart shows, a fall in the number below 20 has invariably led to a rebound in the index, at least since 2011-2012.
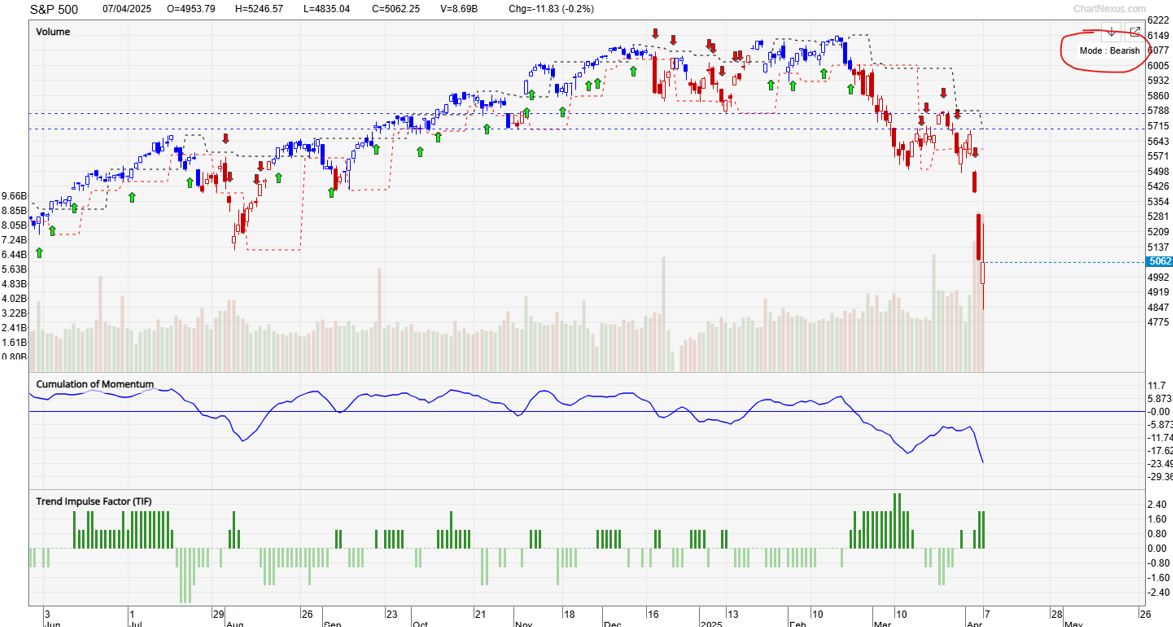
Granted, even though history is any guide, these indicators by itself wouldn’t necessarily ensure a meaningful rebound. For a sustained rebound, there would need to be a strong policy catalyst in the form of central bank action and/or willingness of policymakers to come to the negotiations table or some signs that the trade war is not escalating. Long-term investors looking to dollar-cost-average could gradually consider as the S&P 500 index approaches the lower end of the support range highlighted earlier. Traders looking to trade from the long side, including Position Weekly or Position Daily, might want to wait until the candle colours on the daily and weekly turn Green along with the Trend Impulse Factor.
Regardless of whether you are a trader or a long-term investor, trading stocks without a proper system can be highly risky. This is why the TradersGPS (TGPS) system was created. The indicators will help you determine if a stock is ready for action to be taken. You won’t have to feel in the dark and make wild guesses.