In Singapore’s fast-paced trading environment, knowing how to analyse trends is essential for making informed investment decisions. Here’s what you need to know:
- Long-term trends span years and are shaped by macroeconomic factors like interest rates, inflation, and structural industry shifts. For example, the Straits Times Index (STI) reflects long-term economic changes, such as Singapore’s move from manufacturing to financial services.
- Short-term trends last days to months, driven by immediate factors like news events, earnings reports, or geopolitical developments. For instance, SGX stocks often experience short-term movements during earnings season or MAS announcements.
Key tools for analysing trends include moving averages, regression models, and technical platforms like TradingView or MetaTrader. Long-term strategies rely on broader data and fewer trades, while short-term methods demand active monitoring and quick adjustments. Combining both approaches ensures you capture the bigger picture while responding to immediate opportunities.
Quick Tip: Use a dual-timeframe strategy – long-term analysis for overall direction and short-term insights for precise trade timing. This balance helps manage risk and refine trade entries and exits effectively.
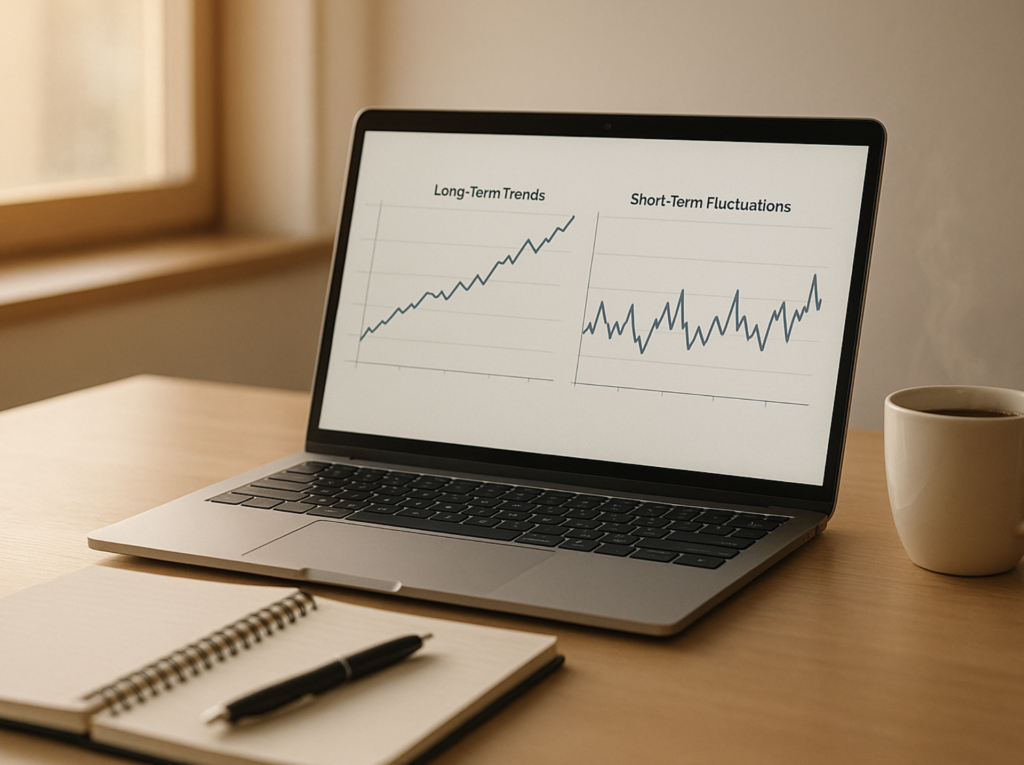
Understanding Long-Term and Short-Term Trends
Market trends unfold over varying timescales, each influenced by different economic and market forces. Recognising these differences is key to crafting trading strategies that fit Singapore’s ever-evolving financial environment. Let’s break down how long-term and short-term trends operate and why understanding both is crucial.
What Are Long-Term Trends?
Long-term trends are sustained market movements that stretch over at least a year. These trends often emerge from significant shifts in economic conditions, industry landscapes, or structural changes within markets.
Macroeconomic factors, such as interest rate cycles, inflation, demographic changes, and technological advancements, are the primary drivers of long-term trends. In Singapore, these trends are evident in the nation’s economic evolution – from its manufacturing roots to its current focus on financial services and the growing prominence of technology sectors within the SGX.
A great example of long-term trends can be seen in the Straits Times Index (STI). Looking at its performance from the 1990s through the 2008 financial crisis and subsequent recovery reveals how major economic events shape sustained market directions over decades.
Currency movements also highlight long-term trends. The Singapore dollar’s consistent strength against regional currencies reflects the nation’s economic stability and sound monetary policies. These long-term patterns often attract position traders and investors with extended time horizons.
What Are Short-Term Trends?
Short-term trends, on the other hand, last anywhere from a few days to several months. These trends are typically sparked by immediate factors like news events, earnings reports, or sudden shifts in market sentiment.
For instance, during earnings season, SGX-listed companies often experience temporary but predictable price movements. When major players like DBS or UOB release quarterly results, market reactions to metrics like profit margins or loan growth can drive trends that last for weeks.
Geopolitical events also play a role in shaping short-term trends. Trade disputes, changes in commodity prices, or regional political developments can trigger rapid market movements before conditions stabilise.
Seasonal factors are another key driver. For example, during the Chinese New Year period, trading volumes often dip, and certain sectors may rotate, while year-end portfolio adjustments can create temporary trends across multiple asset classes.
Why Separate Long-Term and Short-Term Trends?
The distinction between long-term and short-term trends is crucial because each requires a different approach to trading and portfolio management. Long-term trends often call for wider stop-losses, larger positions, and less frequent monitoring. In contrast, short-term trends demand tighter risk controls and more active management.
Capital allocation strategies also differ. Long-term trends are ideal for building core portfolio positions that require patience and commitment. Meanwhile, short-term trends are better suited for tactical moves aimed at capturing quicker profits.
Psychology plays a significant role too. Trading on long-term trends requires patience and the ability to ignore daily market noise, while short-term trading demands quick decision-making and the discipline to exit positions when signals change.
The tools used for analysis also vary. For long-term trends, moving averages and trend lines are particularly effective. For short-term trends, momentum indicators and volume analysis are more useful in identifying opportunities.
Key Tools for Trend Analysis
Having the right tools can make analysing market trends a lot more effective. In Singapore, traders have access to a variety of platforms and software that turn raw market data into actionable insights. Choosing the right tool depends on the type of analysis you’re conducting.
Data Visualisation Tools
Visualisation is key to making sense of complex market data and spotting trends clearly.
- Microsoft Excel: A go-to tool for its simplicity and functionality. Excel is great for creating charts and pivot tables, especially when analysing large datasets from SGX-listed stocks. For example, you can use pivot tables to uncover patterns across different sectors or time periods.
- Tableau: Known for its advanced charting features, Tableau allows you to create interactive dashboards with a simple drag-and-drop interface. This is particularly helpful when comparing long-term trends in the Straits Times Index (STI) with short-term movements in individual banking stocks.
- Power BI: Ideal for combining market data with fundamental analysis. It can connect to multiple data sources, enabling traders to overlay economic indicators from the Monetary Authority of Singapore with stock price movements. This makes it easier to identify correlations.
Visualisation tools simplify complex data. For instance, a basic line chart of the SGD/USD exchange rate over five years can reveal long-term trends, while shorter-term charts might expose seasonal patterns tied to key economic events.
Technical Analysis Platforms
Once patterns are identified visually, technical platforms help confirm these trends in real time.
- TradingView: Offers extensive charting capabilities with over 100 technical indicators. Its real-time SGX stock data makes it highly relevant for Singapore traders.
- MetaTrader 4 and 5: Designed for forex and CFD trading, these platforms come equipped with automated analysis tools like Expert Advisors (EAs). This is especially helpful for tracking SGD movements against other major currencies, even while you’re asleep.
- Bloomberg Terminal: Though pricey, it provides unmatched access to real-time market data and advanced analysis tools. Many professional traders in Singapore rely on its pattern recognition and statistical analysis features.
- ThinkorSwim: Known for its professional-grade charting tools, it also includes advanced options analysis. Its paper trading feature is perfect for testing strategies without risking actual capital, helping traders differentiate between genuine trends and market noise.
Statistical and Predictive Tools
For traders who rely on quantitative methods, these tools offer powerful capabilities.
- R and Python: Both are excellent for time series analysis, regression modelling, and machine learning. Python’s pandas library, for instance, can quickly calculate rolling correlations between STI components, helping you identify which stocks lead or lag market movements.
- SPSS: A user-friendly option for statistical analysis, particularly useful for those without programming skills. Its regression tools can help you explore relationships between economic indicators and market trends, such as how shifts in Singapore’s GDP growth affect banking sector performance.
- MATLAB: Ideal for advanced mathematical modelling, MATLAB excels at identifying cyclical patterns in market data. Its signal processing features are particularly useful for filtering out market noise, which is crucial in volatile sectors like SGX-listed technology stocks.
- TensorFlow and scikit-learn: These tools are great for building predictive models. They can help detect early signs of trend reversals by analysing volume, volatility, and price action across various timeframes.
The systematic trading approach taught at Collin Seow Trading Academy highlights the importance of using these tools thoughtfully. Their resources guide traders on selecting the right tools for specific market conditions and combining different methods for more reliable trend analysis.
Methods Used to Analyse Trends
Turning raw data into actionable insights is key for successful market analysis. By applying the right methods, traders can transform market data into signals that help track trends and make informed decisions. Let’s dive into some effective techniques.
Using Moving Averages
Moving averages are a popular tool for smoothing out price fluctuations, making it easier to spot trends. A widely used benchmark for long-term analysis is the 200-day simple moving average (SMA). If prices consistently stay above this line, it often signals a bullish trend. On the flip side, prices below the 200-day SMA might indicate bearish sentiment.
For short-term analysis, exponential moving averages (EMA) are especially useful. Unlike SMAs, EMAs give more weight to recent prices, making them quicker to react to market changes. Comparing a shorter-term EMA to a longer-term EMA can reveal momentum shifts or potential trend reversals. For example, in currency trading, a medium-term SMA might highlight overall trends, while a shorter-term EMA can help capture volatility during key announcements, such as those from the Monetary Authority of Singapore.
Applying Regression Analysis
Regression analysis is a powerful tool for identifying relationships between variables and predicting future market movements. Linear regression, for instance, creates a trend line through price data. A positive slope often suggests an upward trend, while the R-squared value measures how closely the data follows this trend.
For more complex scenarios, multiple regression can combine market data with economic indicators like GDP growth or interest rates, offering a broader perspective. Polynomial regression, on the other hand, is particularly useful for capturing non-linear relationships and spotting cyclical patterns, such as seasonal trends tied to dividend payouts or interest rate changes.
At Collin Seow Trading Academy, systematic trading strategies often integrate regression analysis with other technical methods. This combination not only strengthens the accuracy of insights but also reduces the risks of relying on a single indicator.
Separating Noise from Patterns
Market data is a mix of meaningful trends and random fluctuations, so distinguishing between the two is crucial. Tools like trend lines and channels help traders focus on the real trends by connecting key highs and lows. Even when temporary spikes occur, these visual aids can reveal the underlying direction.
Volume analysis is another effective way to confirm trends. Price movements accompanied by high trading volume are usually more reliable, while similar moves on low volume might signal false breakouts. Statistical tools like Bollinger Bands can also help identify whether price changes represent genuine trend shifts or are just temporary volatility.
Analysing data across multiple timeframes adds even more clarity. For instance, a daily chart might show a sudden spike that seems significant. However, when viewed alongside weekly or monthly charts, it could simply be part of normal market fluctuations. These methods help refine your understanding of the market and prepare you for well-timed entries and exits.
Master Systematic Trading with Collin Seow
Learn proven trading strategies, improve your market timing, and achieve financial success with our expert-led courses and resources.
Step-by-Step Guide to Analyse Trends
Taking a structured approach to trend analysis helps traders make better decisions and reduces the influence of emotions. By following a clear process, you can identify both short-term opportunities and long-term market trends with greater precision.
Step 1: Collect Market Data
Start by gathering data from reliable sources for SGX-listed equities, REITs, and ETFs. The historical price data you collect should include daily open, high, low, and close prices, along with trading volumes.
Don’t forget to factor in key economic indicators like the STI’s performance, announcements from MAS, GDP figures, and corporate actions such as quarterly dividends. For those trading currencies, keep a close eye on SGD exchange rates against major currencies like USD, EUR, and JPY.
Verify your data’s accuracy and consistency by cross-checking multiple sources. Even a single missing or incorrect data point can throw off your analysis. Make it a habit to update your data daily after the market closes at 5:00 PM SGT. Store this information in a structured format so it’s easy to access and analyse.
For Singapore companies, which typically announce dividends quarterly, be sure to account for these events in your datasets. Dividends can create artificial price gaps, so adjusting for them is crucial to maintain accurate trend calculations.
Step 2: Choose the Right Analysis Method
Once you’ve gathered high-quality data, the next step is selecting the right tools and methods for analysis based on your trading goals and timeframe.
Tailor your method to your trading style. For example, day traders focusing on SGX blue-chip stocks like DBS Group or Singapore Airlines might rely on short-term indicators such as 5-day and 20-day EMAs. On the other hand, long-term investors building portfolios around Singapore REITs may benefit more from 50-day and 200-day SMAs.
Combine different analytical approaches to get a clearer picture. Use moving averages to identify the primary trend direction, add regression analysis to measure trend strength, and incorporate volume analysis to confirm whether price movements reflect actual market sentiment or temporary noise.
Adapt to market conditions. During volatile times, such as MAS policy announcement days, tools like Bollinger Bands and volatility indicators become especially useful. In trending markets, momentum indicators and trend-following methods often provide better insights.
Understand the behaviour of each asset. For instance, Singapore bank stocks often move in line with interest rate expectations, making fundamental analysis an important complement to technical methods. Meanwhile, SGX-listed technology stocks, with their higher volatility and growth focus, may require a different approach.
Once you’ve chosen your method, stick to it consistently, but be ready to adjust your analysis as market conditions shift.
Step 3: Interpret Findings
When interpreting your analysis, it’s important to validate your signals across multiple timeframes.
Look for alignment across daily, weekly, and monthly charts. A bullish signal on a daily chart carries more weight if it’s also supported by weekly and monthly trends. Make decisions based on confluence between multiple indicators rather than relying on a single signal.
Review trends regularly. For long-term strategies, a weekly review is sufficient, while short-term strategies require daily updates. Markets can change quickly, and yesterday’s trends might no longer apply today. This systematic approach is similar to the methods taught at Collin Seow Trading Academy, where disciplined processes are emphasised to minimise emotional decision-making.
Track your outcomes to improve your methods. Keep a record of your trend predictions and their results. This will help you identify which strategies work best for your trading style and build confidence in your approach over time.
Incorporate new information as it arises. Singapore’s market is influenced by regional developments, government policy changes, and global economic events. For example, if MAS adjusts its policies or major SGX companies release earnings, revisit your trend analysis to include these updates.
Stay flexible while maintaining discipline. Markets evolve, and clinging to outdated analysis can lead to costly mistakes. Regularly updating your approach ensures your trend analysis stays relevant and actionable in Singapore’s ever-changing trading environment. This balance between flexibility and discipline is key to effective trend analysis.
Comparing Long-Term and Short-Term Trends
Understanding the differences between long-term and short-term trend analysis is key to aligning your trading strategies with your goals. Each approach serves a distinct purpose and comes with its own set of benefits and challenges, especially in the context of Singapore’s financial markets.
Long-term trend analysis focuses on filtering out daily market noise to identify sustained movements, such as those seen in blue-chip stocks like DBS Group. On the other hand, short-term analysis hones in on rapid price changes driven by immediate events, like earnings announcements. Long-term strategies are well-suited for Singapore’s stable stocks, where price movements are often shaped by fundamental factors. Meanwhile, short-term strategies appeal to traders aiming to seize quick opportunities in more volatile SGX-listed stocks.
The primary distinction lies in how each method handles volatility. Long-term analysis smooths out fluctuations over time, while short-term analysis leverages these fluctuations for potential gains. Choosing between the two depends on factors like your risk tolerance, the time you can dedicate to monitoring trades, and your available capital.
Comparison Table: Long-Term vs Short-Term Trends
| Aspect | Long-Term Trends | Short-Term Trends |
|---|---|---|
| Timeframe | 6 months to several years | Days to 3 months |
| Data Requirements | Weekly/monthly price data, fundamental metrics | Daily/hourly price data, volume patterns |
| Key Influencing Factors | Economic cycles, company fundamentals, MAS policy changes | Market sentiment, news events, technical patterns |
| Primary Tools | 50-day/200-day SMAs, regression analysis, fundamental ratios | 5-day/20-day EMAs, RSI, MACD, Bollinger Bands |
| Capital Requirements | Higher initial investment, ideal for portfolios above S$50,000 | Lower barriers, can start with S$5,000–S$10,000 |
| Time Commitment | Weekly reviews, 2–3 hours per week | Daily monitoring, 1–2 hours per day |
| Risk Level | Lower volatility, gradual losses/gains | Higher volatility, rapid profit/loss potential |
| Transaction Costs | Lower due to fewer trades | Higher due to frequent trading |
| Suitable Assets | SGX blue-chips, REITs, dividend-paying stocks | Growth stocks, ETFs, currency pairs |
| Success Rate | Higher accuracy over extended periods | Lower accuracy but faster profit opportunities |
| Emotional Stress | Lower stress, less frequent decision-making | Higher stress, requires discipline and quick decisions |
This comparison illustrates how your choice between long-term and short-term strategies hinges on factors like market conditions and personal trading preferences. Beyond methodology, practical considerations such as transaction costs also play a role. For instance, in Singapore, long-term strategies incur fewer brokerage fees, whereas short-term trading can see profits diminished by commissions and bid–ask spreads, particularly for smaller trades.
Market conditions further determine which approach might be more effective. During stable periods, long-term trends often provide clearer signals. However, in volatile situations – like the March 2020 market crash or major announcements from the Monetary Authority of Singapore (MAS) – short-term analysis can help you respond to rapid changes.
Many successful traders adopt a hybrid approach, combining both methods. Long-term analysis helps establish the broader market direction, while short-term signals fine-tune entry and exit points. This blend allows traders to balance the strengths of both strategies while mitigating their individual shortcomings.
For more detailed strategies and insights into applying these approaches, check out the educational resources available at Collin Seow Trading Academy.
Conclusion: Mastering How to Analyse Trends for Better Trading Decisions
Effective trend analysis is essential for navigating Singapore’s financial markets with confidence. Understanding the difference between long-term and short-term trends – and knowing when to use each – can be the deciding factor between steady gains and avoidable losses. Whether you’re analysing the performance of Singapore REITs or monitoring the daily price movements of growth stocks, a systematic approach helps demystify market complexities.
Long-term and short-term trends each serve a distinct purpose, but they work best when used together. Think of them as complementary tools rather than competing strategies. Long-term analysis provides a clear picture of the overall market direction, helping you establish a strong foundation for your trading decisions. Meanwhile, short-term analysis sharpens your timing, ensuring you make well-calculated entry and exit points. This dual approach is especially valuable in Singapore, where updates like MAS announcements or earnings reports from major SGX-listed companies can create both immediate and lasting market impacts.
Structured trading strategies help you avoid emotional pitfalls. By relying on methods such as moving averages, regression analysis, or technical indicators, you can filter out market noise and focus on meaningful patterns. This disciplined framework becomes even more critical during volatile market periods, when emotions often lead to impulsive and costly decisions.
While tools and strategies are vital, mastering trend analysis also requires ongoing learning and real-world application. Singapore’s markets offer diverse opportunities, from the stability of blue-chip banking stocks to the growth potential of emerging tech firms. Each sector demands a tailored approach to analysis, further underscoring the importance of refining your skills.
For traders ready to deepen their expertise, the Collin Seow Trading Academy provides a range of resources to support your journey. From free e-courses like Market Timing 101 to advanced trading programmes, these educational tools are designed to turn theoretical concepts into actionable trading strategies. With a structured learning environment, you can build the skills needed for consistent success in the market.
Ultimately, success in trend analysis boils down to consistency, discipline, and adaptability. By combining insights from both long-term and short-term trends with systematic trading principles, you’ll be better equipped to make informed decisions and navigate Singapore’s markets with confidence.
FAQs
How can I use both long-term and short-term trend analysis to improve my trading strategy?
To refine your trading strategy, try combining long-term and short-term trend analysis using multi-timeframe analysis. This method involves studying various timeframes to get a more comprehensive view of market trends. Long-term charts, such as weekly or monthly ones, reveal the broader market direction, while short-term charts, like daily or hourly, help pinpoint optimal entry and exit points.
You can use tools like Moving Averages to track long-term trends and oscillators like the RSI or Stochastic for identifying short-term signals. This combination helps ensure your trades align with the overall market direction while improving the timing of your decisions. By integrating these techniques, you can create a more structured and responsive trading approach that adapts to market dynamics.
What tools and techniques are best for analysing short-term market trends in Singapore?
To get a handle on short-term market trends in Singapore, technical analysis tools are your best bet. Tools like moving averages and candlestick charts can help you spot patterns and predict price movements. Platforms such as TradingView make this process simpler with user-friendly charting and analysis features, perfect for short-term traders.
Many traders in Singapore also turn to leveraged instruments like CFDs to take advantage of rapid price changes. For success in this fast-paced market, it’s crucial to use tools that provide real-time data and allow you to customise indicators. This way, you can react swiftly and make well-informed decisions in Singapore’s ever-changing market landscape.
How do macroeconomic factors shape long-term trends in Singapore?
Macroeconomic factors play a big part in shaping Singapore’s long-term economic direction, impacting both its stability and growth. Some of the key influences include government policies, inflation rates, productivity levels, and global trade conditions. For instance, Singapore’s steady focus on infrastructure and workforce development has been crucial in maintaining its resilience. The country’s low debt levels and emphasis on innovation further contribute to its ability to sustain growth over time.
As an economy heavily dependent on international trade, external factors like global demand for exports and changes in trade policies directly affect Singapore. Meanwhile, demographic shifts, such as an ageing population, bring their own challenges. To address these, efforts are underway to boost productivity and drive innovation, ensuring the economy remains competitive and prepared for the future.