Geopolitical Relief Drives Market Rebound
Equity markets cheered the US-Iran agreement for a two-week ceasefire in Asia on Wednesday morning.
US President Donald Trump agreed to suspend planned attacks on Iranian infrastructure for two weeks; in return, Iran agreed to the safe passage of ships through the Strait of Hormuz during the period.
Oil prices plunged 15%, Japan equities soared 5%, South Korean and Hong Kong equities jumped over 2%, while US futures indicate the S&P 500 is up about 2.5% following the news.
Market Sentiment: From Extreme Fear to Recovery
Before the announcement, equity market sentiment was deeply pessimistic – the CNN Fear & Greed Index was in ‘Extreme Fear’ territory. That partly reflects the 10% peak-to-trough decline in the S&P 500 since the conflict began at the end of February.
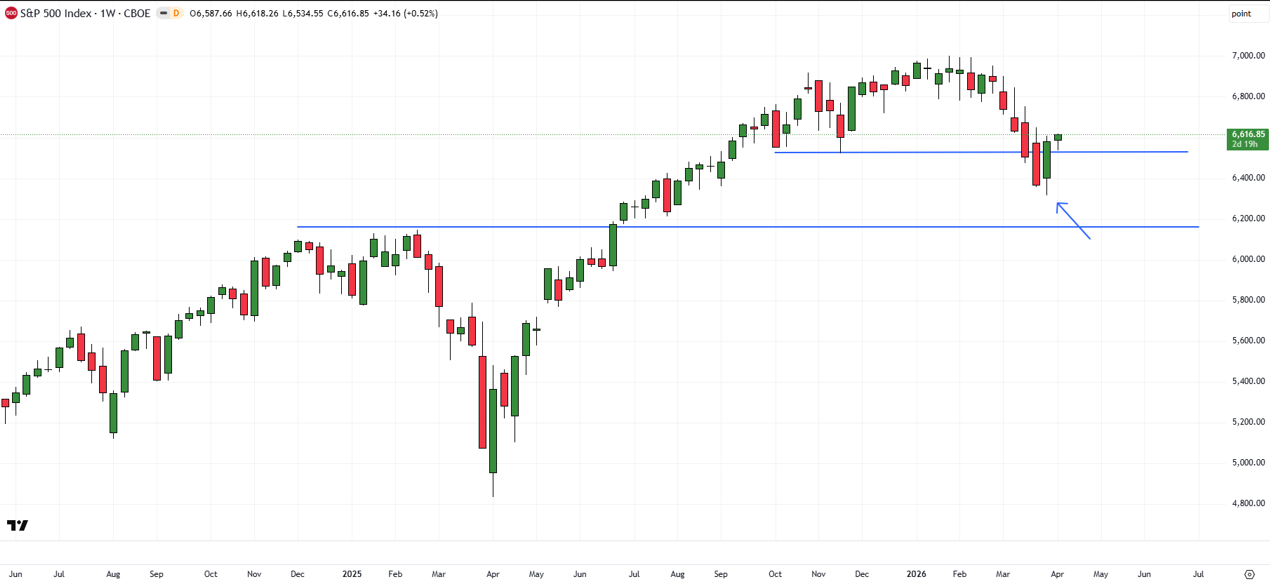
Signs of fatigue had emerged even before the conflict in the Middle East began at the end of February, as the weekly chart with the rising channel shows. Early February, we had highlighted the risk of a retreat in the S&P 500 (“US Equities: Possibility of a Minor Correction,” dated 6 February 2026).
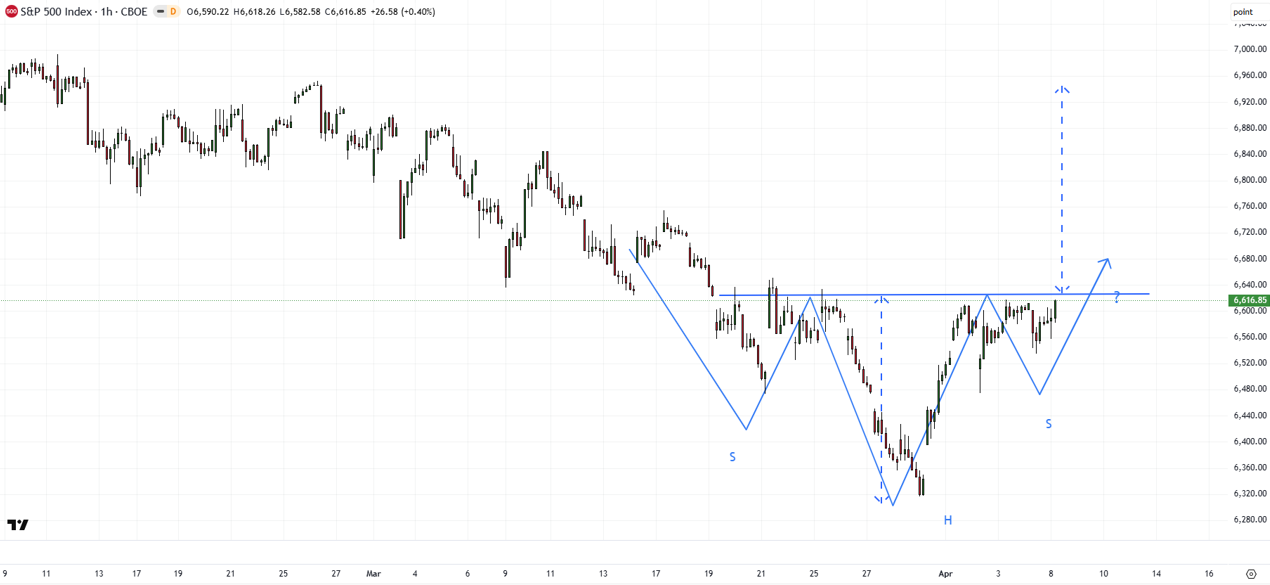
However, recent price action on technical charts shows a potential head & shoulders pattern, pointing to the possibility that the index has found an interim floor. Any break above the neckline at 6625 would trigger the pattern, with a potential price objective of a retest of the 7000-mark.
The US futures market pricing suggests the index is already above the neckline.
S&P 500 (Hourly):
On the weekly chart, the index’s failure to decisively break key support at the end-of-2025 low of 6535 is a sign that the uptrend since April 2025 remains intact.
S&P 500 (Weekly):
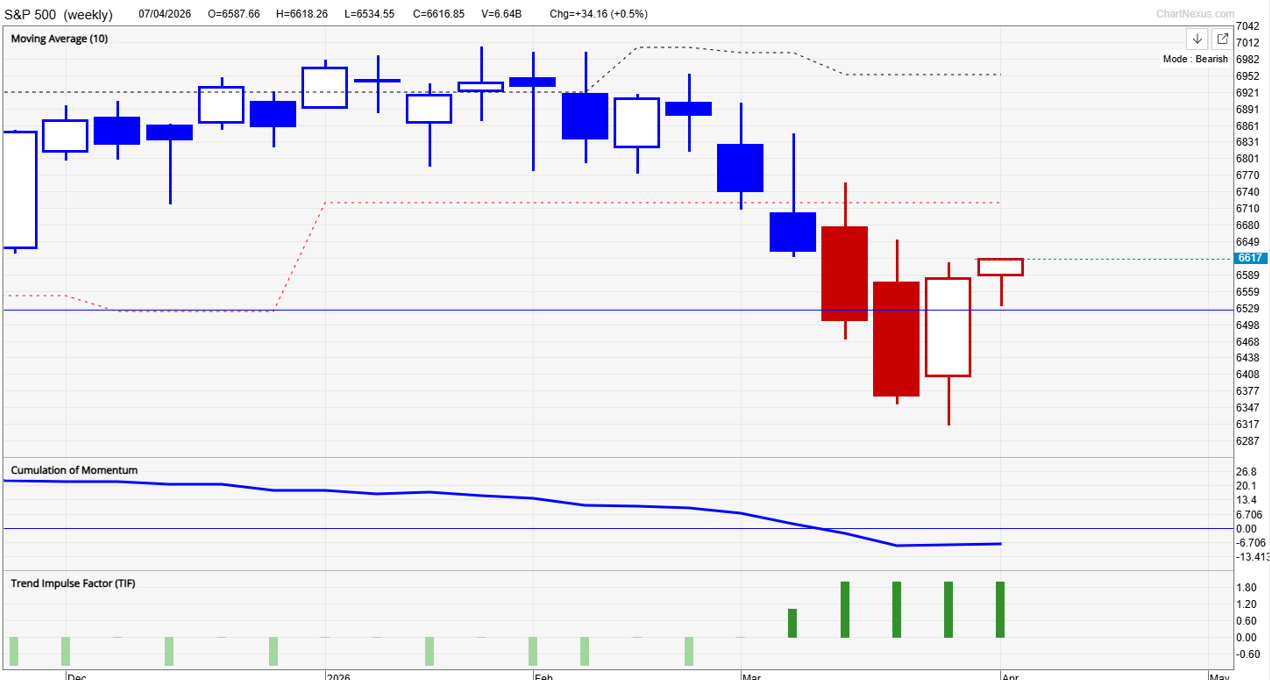
Meanwhile, our proprietary system TradersGPS (TGPS) remains Bearish. The candle colour turned Red mid-March on the Weekly chart. On the Daily chart too, the system remains bearish.
As per our system, we would wait for the candle colour to change to Blue to confirm that the trend had indeed changed to bullish. Blue coloured candles indicate the trend is Bullish; Red coloured candles indicate the trend is Bearish.
S&P 500 Index (Weekly):
Trading Strategy Considerations
To be fair, last year’s tariff selloff and the subsequent sharp rebound have demonstrated that rebounds can be ‘V-shaped’. Keeping the recent past in mind, an aggressive approach would be to chase the market; a cautious/systematic stance would be to wait for the signal on the TGPS system.
Meanwhile, news reports suggest sirens continue to sound across the Gulf even after Trump announced a two-week ceasefire with Iran, with Israel still carrying out strikes on Iran. Whether it is part of the winding-down ceasefire process or a continuation of hostilities remains to be seen.
Having said that, the authorities’ willingness to come to the negotiation table is a huge positive for markets, which could underpin sentiment while the finer details of the ceasefire / eventual end of the conflict are being worked out.
FAQ
Is the worst over for US equities?
The recent rebound suggests a potential interim bottom, but confirmation is still needed as technical signals remain mixed.
What triggered the recent stock market rally?
The US-Iran ceasefire announcement led to a sharp drop in oil prices and improved global risk sentiment.
What technical pattern is forming on the S&P 500?
A head and shoulders pattern is forming, with a break above 6625 signaling a potential move toward 7000.
What does TradersGPS indicate?
The TradersGPS system remains bearish on both daily and weekly charts, indicating caution is still warranted.
Should investors chase the rally?
Aggressive traders may chase momentum, but a cautious approach would wait for confirmation from technical indicators.