How To Trade Using Bollinger Bands
If you are a technical trader but you haven’t tried using this indicator, you really need to dig in and check it out.
Here I’d like to share my two best uses of Bollinger Bands.
Bollinger bands are ranked among the most useful indicators in the arena of trading.
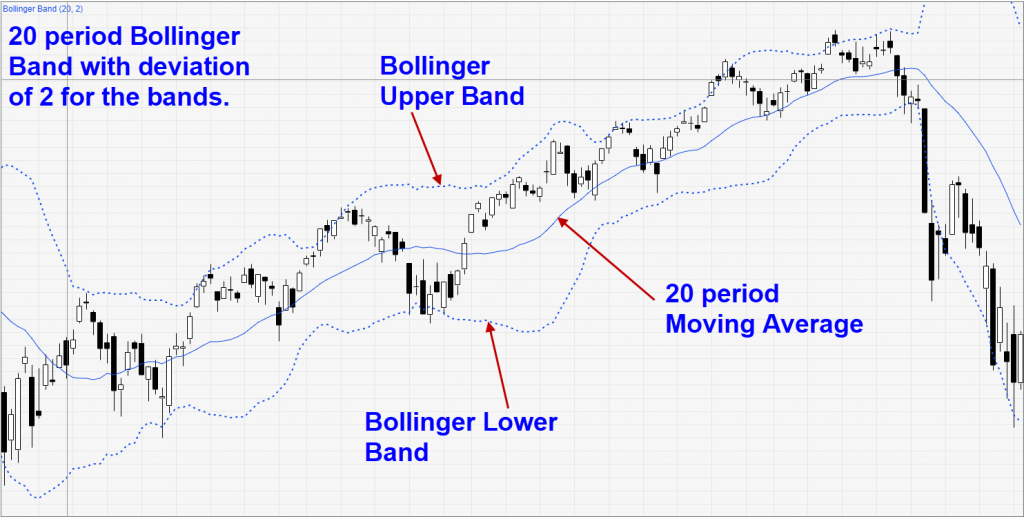
Consisting of a moving average and 2 bands above and below, take a look at the chart above.
This indicator was created by John Bollinger back in the early 1980s and has taken the world by storm since.
One of the most difficult challenges in trading, is managing volatility.
This is exactly what Bollinger bands can help us with, by providing one of the simplest ways to keep tabs on volatility. Giving us a pretty good idea of where we are in the markets and how we can trade.
There are many viable ways to use Bollinger bands to trade the markets, regardless of whether it’s ranging or trending.
Bollinger bands are one of the most extensively explored indicators in the world of trading.
So I doubt there’s a good way to use them which hasn’t already been discovered by some trader out there.
But let me share with you a couple of my favourite ways to use the Bollinger Bands. Amongst all the ways to use Bollinger Bands, I find these to be the most useful ways for me to process market information.
Do note that these are NOT full strategies on their own.
They must be augmented with additional factors and rules for entry and exits, before they can actually be a full trading system.

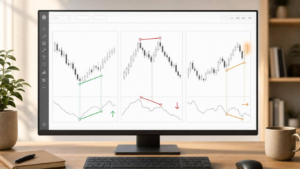
#1 Double Top/Bottom Reversal
I use this to identify potential market reversals.
This is a contextual analysis so I’ll apply these to higher timeframes such as H4 or daily charts form my big picture before I dive in looking for my entries. It’s good on more volatile markets like FX and indices.
- We look for the end of a directional move to pierce through the Bollinger band.
- Then after price retraces and pauses, look for another push in the same direction where the highest/lowest point does not pierce through the Bollinger band.
Ideally this 2nd push will exceed the first push as well, but if it doesn’t, it’s alright too.
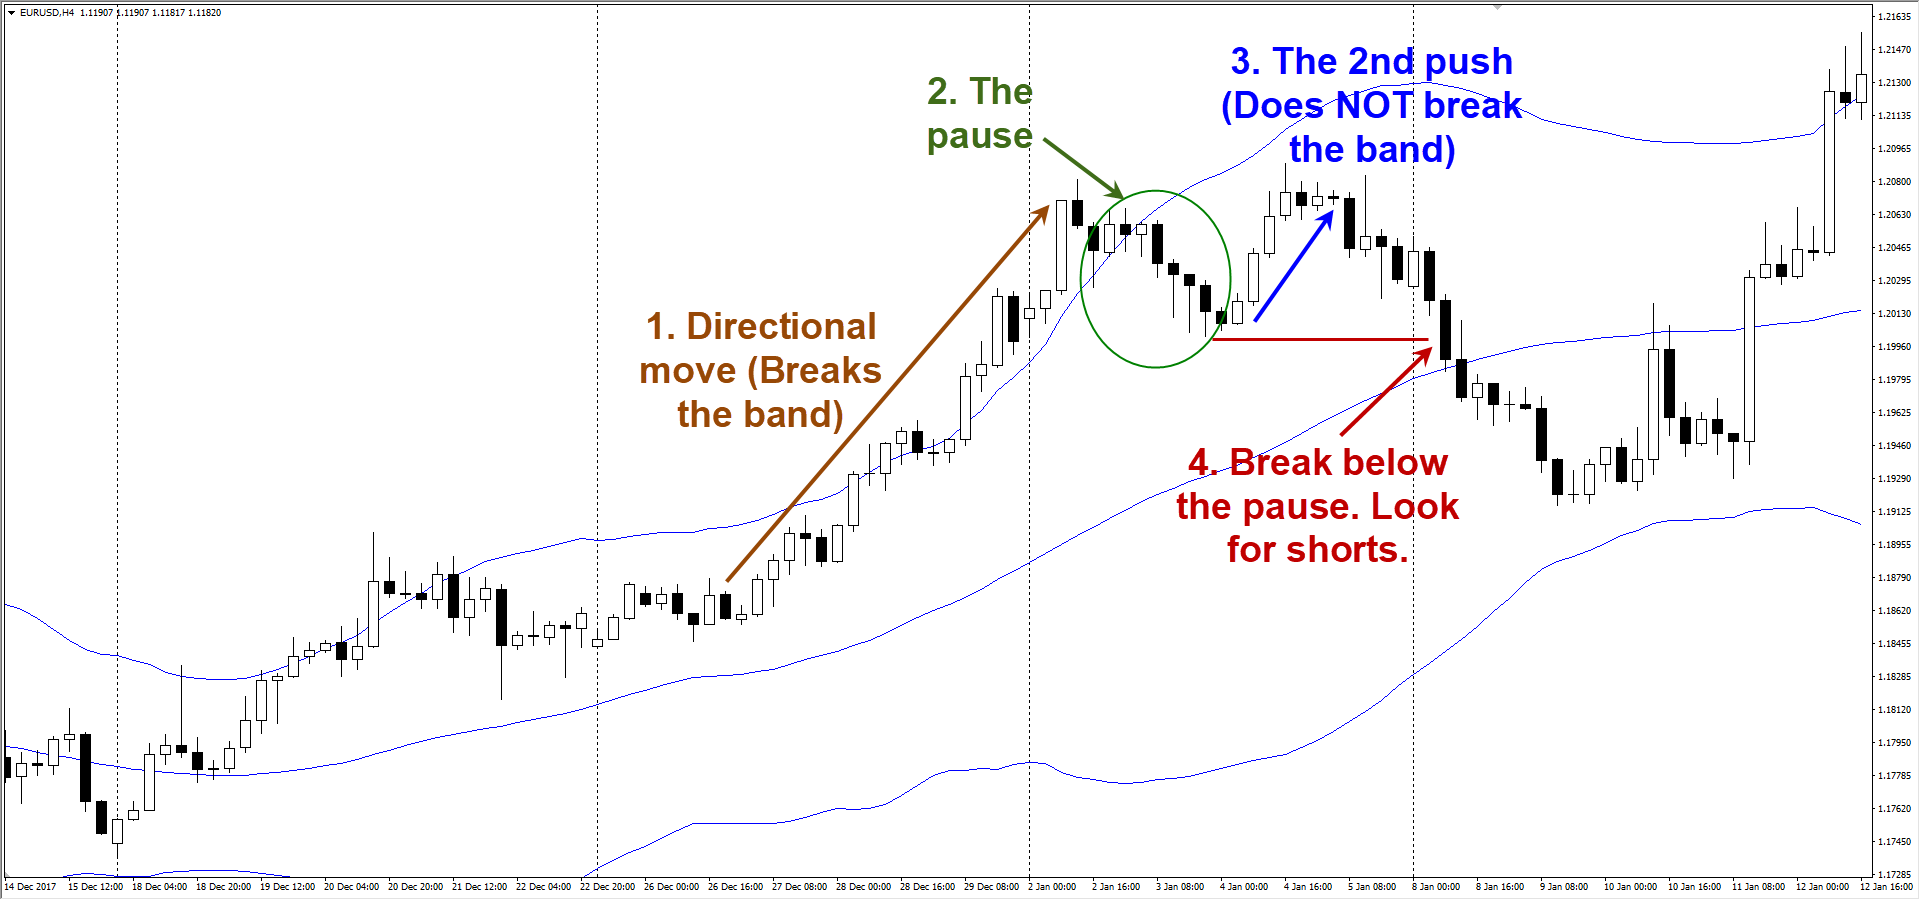
For example below,
Part 1: We see a directional movement upwards. The end of the move pierces the upper Bollinger band.
Part 2: Price pauses.
Part 3: Price makes another push upwards. This time the price movement does not pierce the Bollinger band.
Part 4: When the low of the pause is broken, we look to get short on this market, and this is where your other shorter timeframe strategy’s entry and exit rules come into play.
Here are a few more examples on the EURUSD H4 chart:
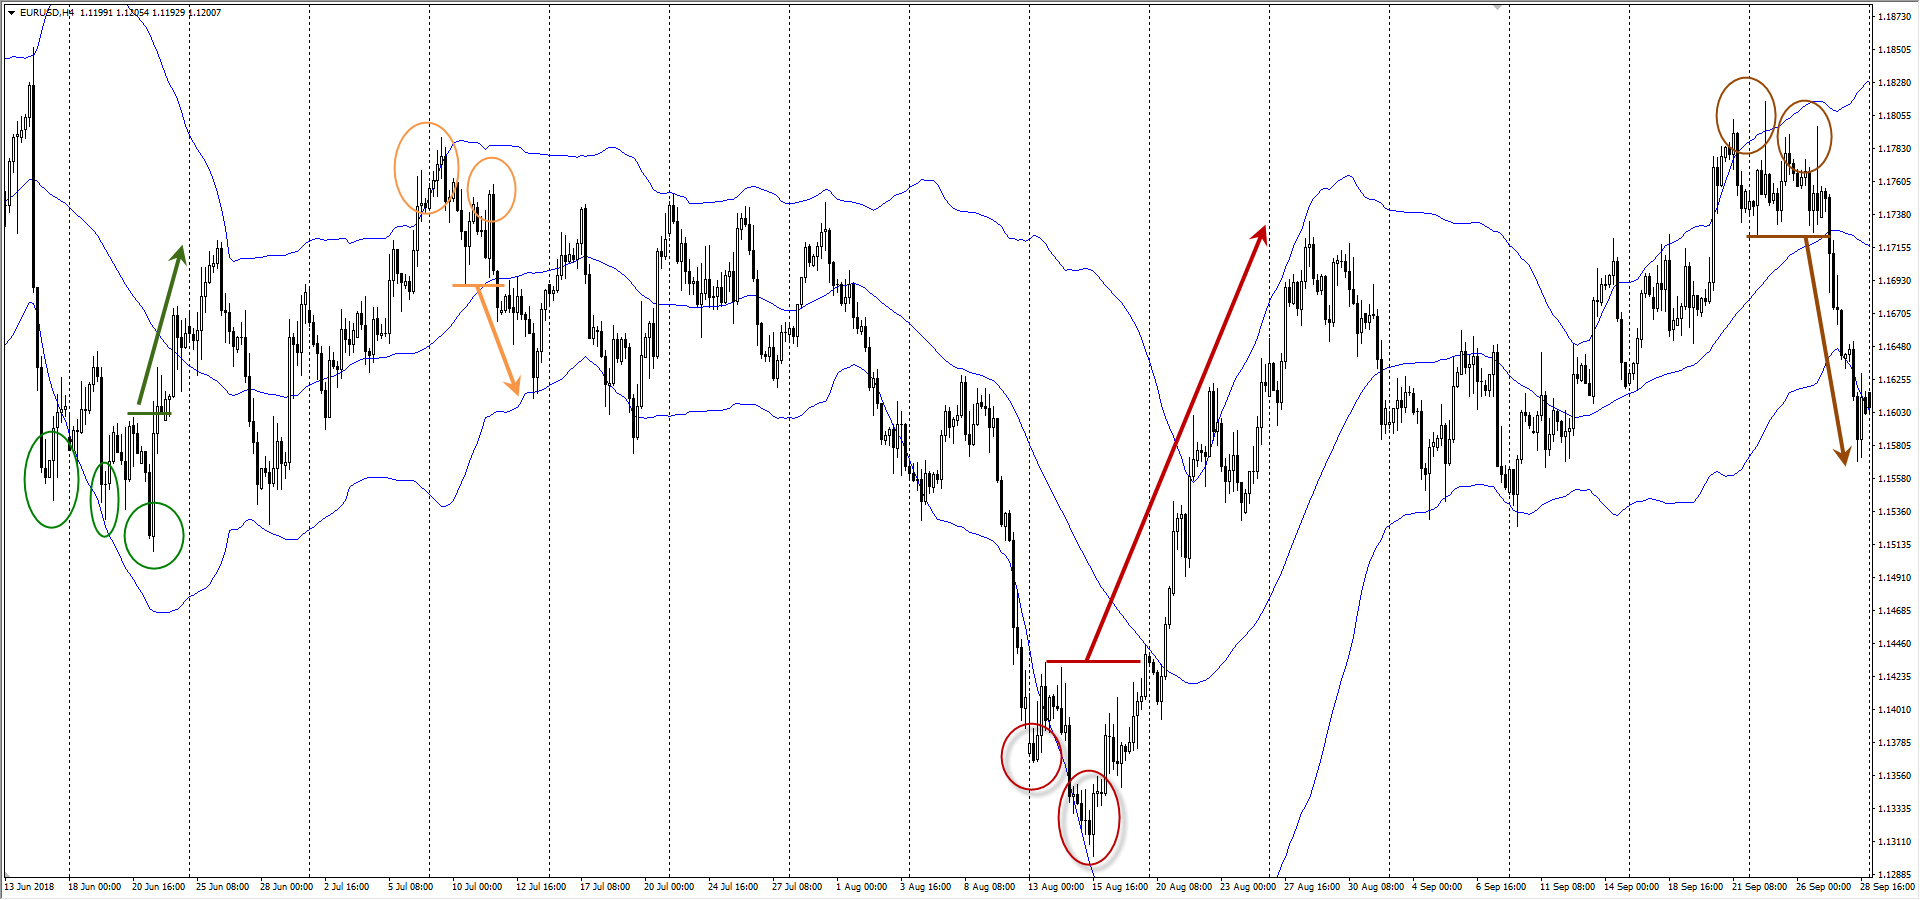
For FX, I find that a 50 period Bollinger Bands with a deviation of 2 gives me better signals than the standard 20 period.
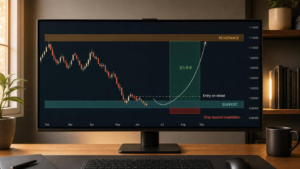
#2 Bollinger Squeeze
This is a crowd favourite, used to capture potentially large impulse moves.
There are a few methods of trading this, so I’ll just be sharing the way which works best for me. (Different from Collin’s way)
These are mostly used in the H4 or Daily charts.
The concept is basically that volatility cycles between periods of low volatility and high volatility.
This means a period unusually low volatility is regularly followed by a period of high volatility, which again is then followed by a period of low volatility.
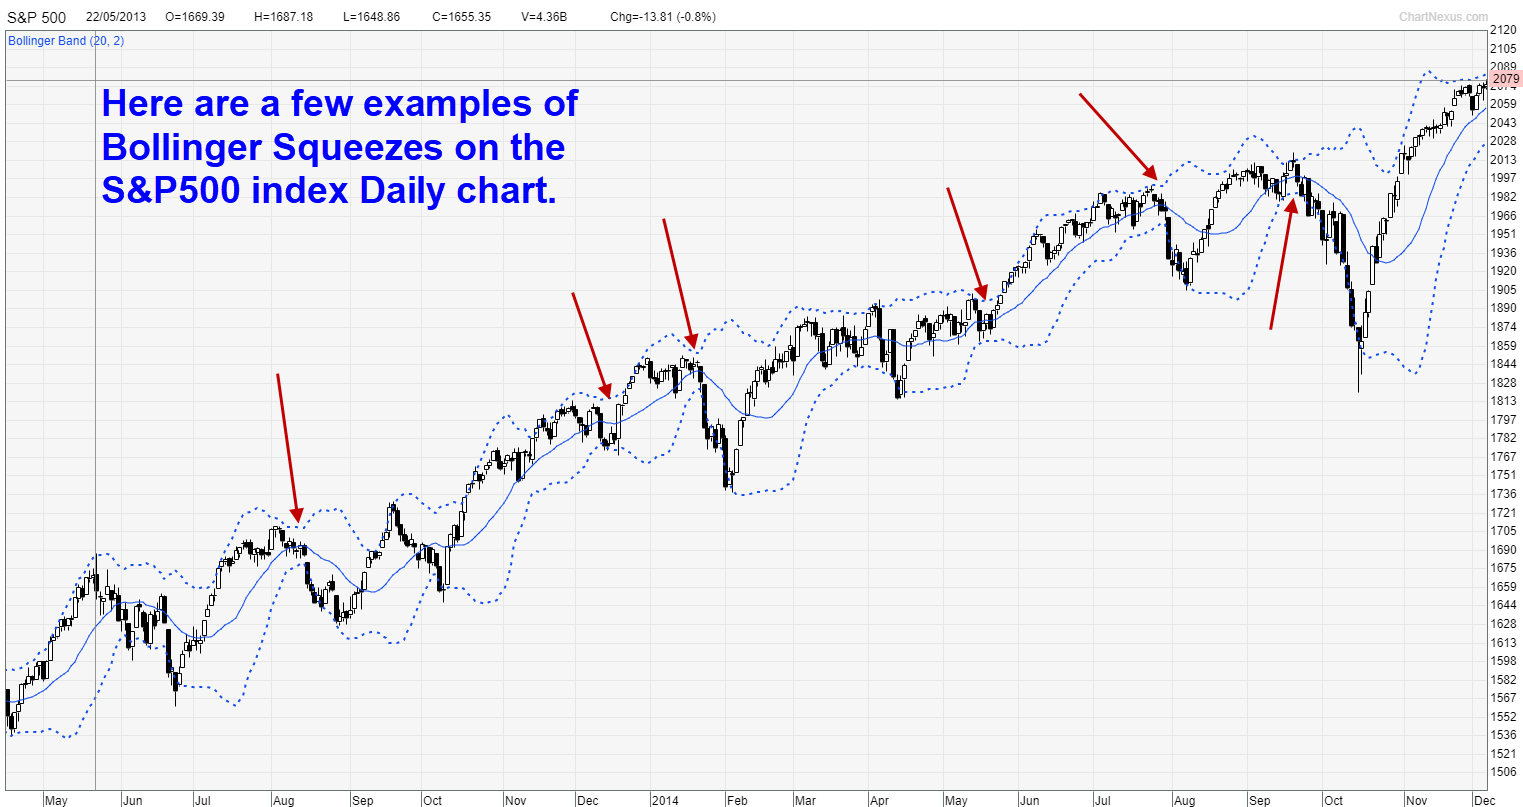
The Bollinger Squeeze aims to identify when the market is at a period of unusually low volatility, then we can get ready to take advantage of the coming period of high volatility.
For the Bollinger Squeeze, I use the standard 20 period Bollinger Bands with a deviation of 2.
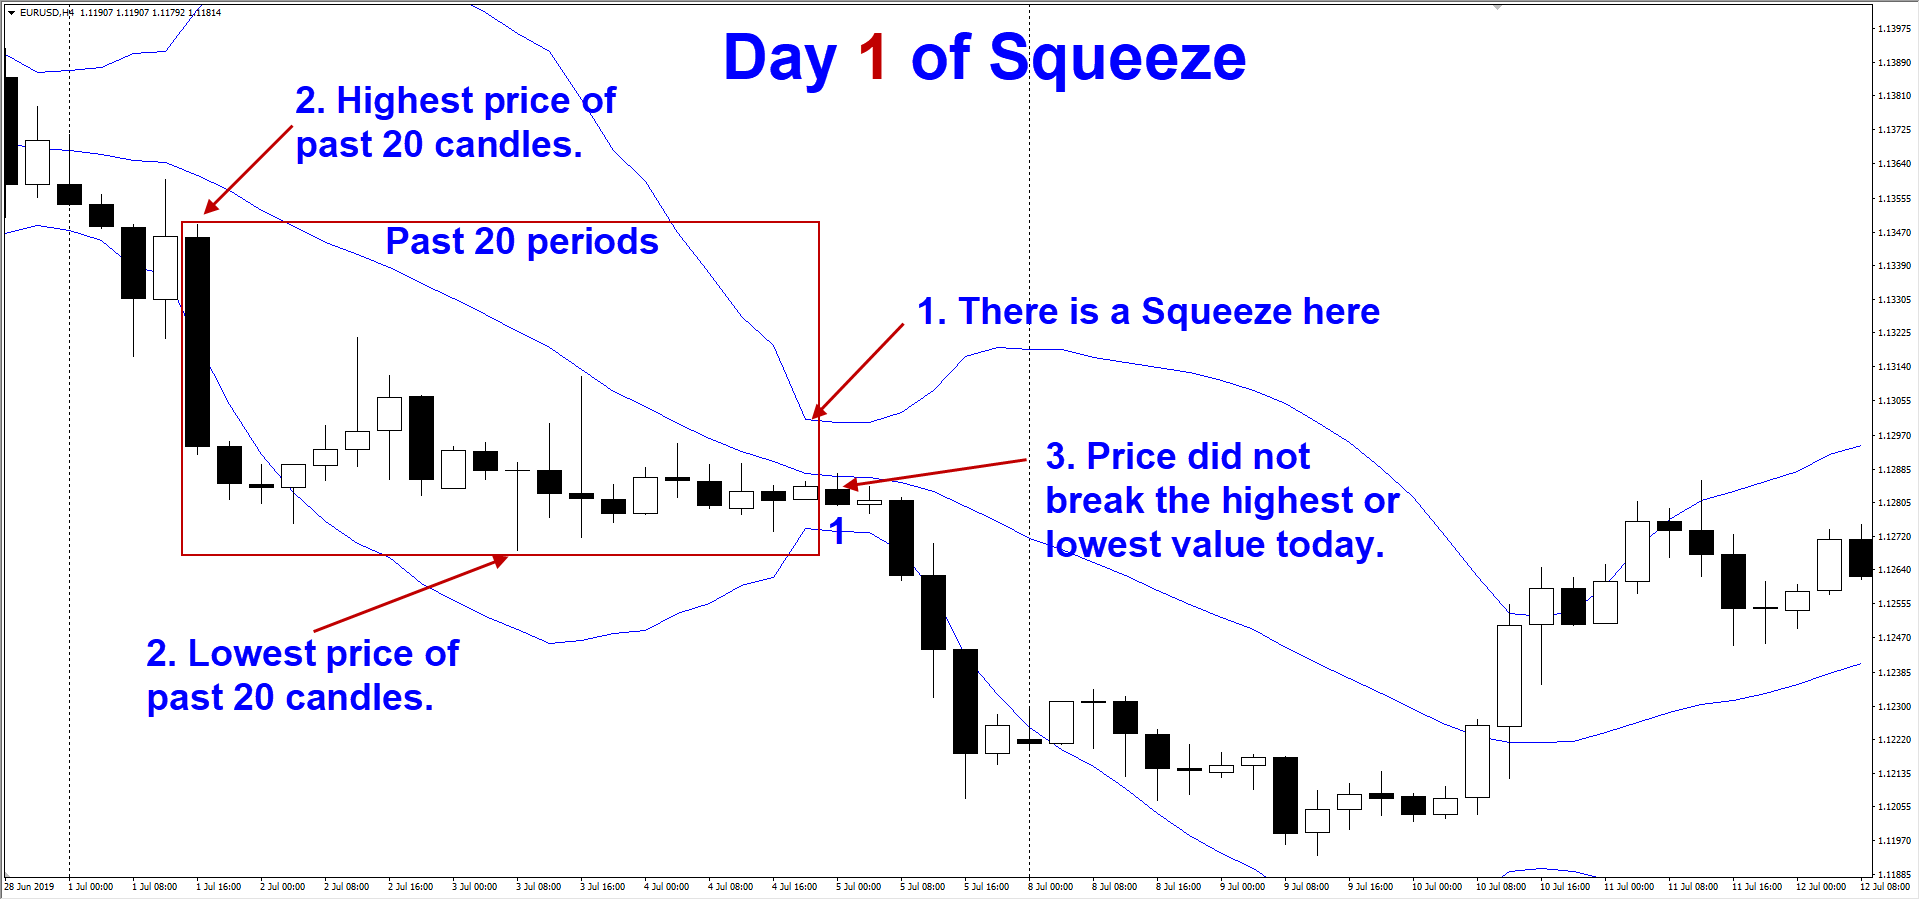
Part 1: Identify that the bands are significantly closer than usual (the Squeeze). Usually price would have been trading in a fairly tight range as well.
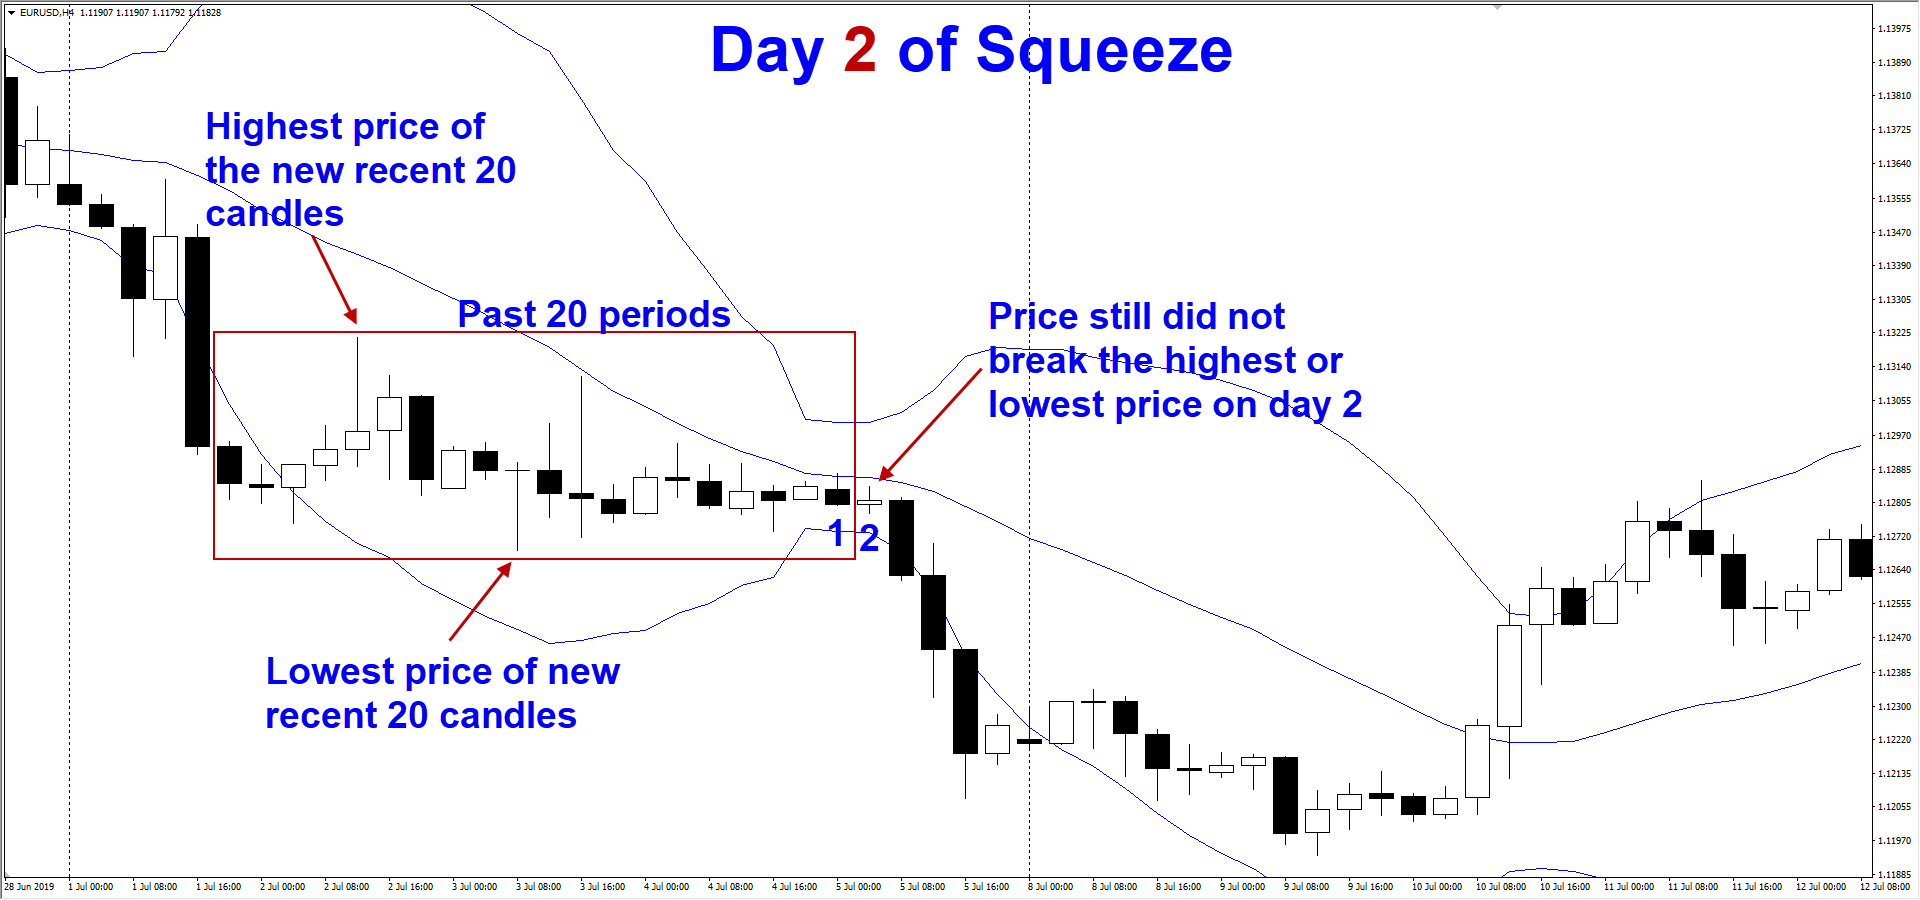
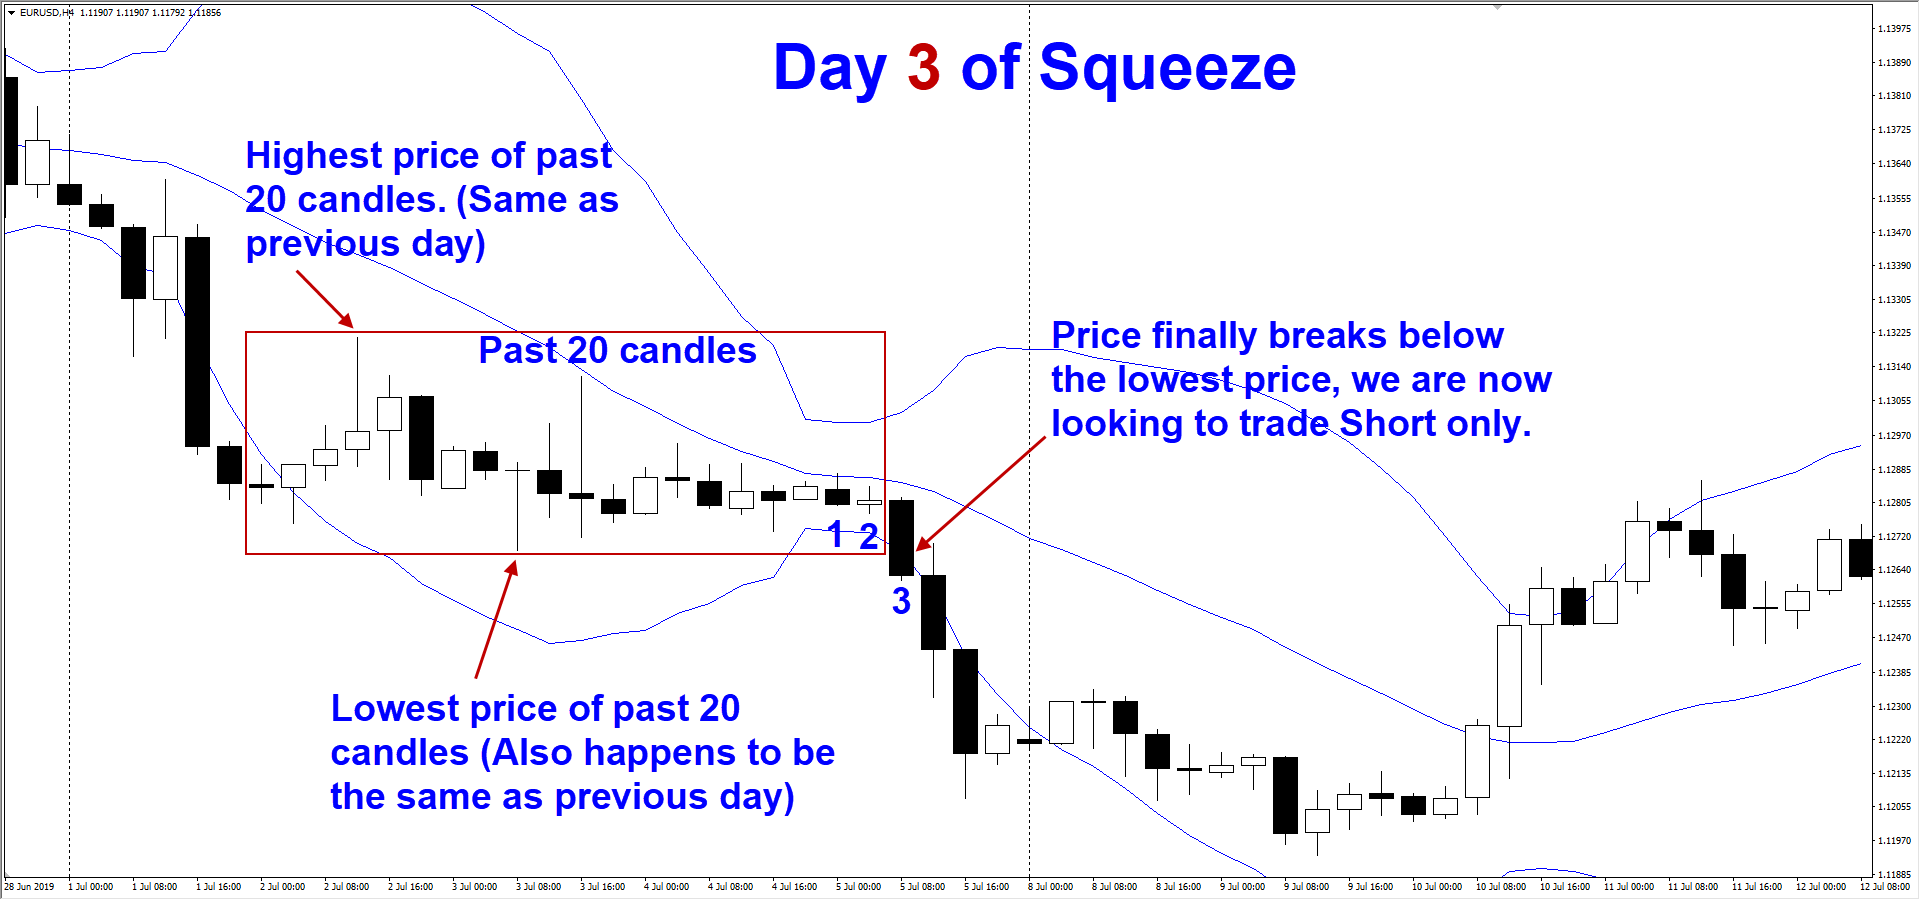
Part 2: Keep track of the highest and lowest price of the MOST RECENT past 20 periods.
Part 3: If price breaks through this highest or lowest price of the past 20 periods, then you’re looking to trade in that direction. You can then implement your entry and exit rules on the lower timeframes.
Part 4: If during the current candle, price does NOT break the highest or lowest value in part 2, repeat step 3 until price finally breaks either the highest or lowest value which you are tracking.
I’ve illustrated this with an example below.
Note: Day 1 is the day after the squeeze has been formed.
Bonus Pro Tip:
If it doesn’t work out the first time in the direction of the breakout, you can flip to trade in the opposite direction.
I hope you’ll enjoy these 2 ways to use Bollinger bands and may they bless your pockets with gold!