
3 Things You Absolutely Must Know About Technical Analysis!
The study of price charts, known as Technical Analysis, has long brought much controversy to the world of financial trading. Does it really work?
If it works, why would the study of lines on a chart actually help us profit from the markets? It may all seem rather superstitious or even magical but let me assure you it is nothing of that sort.
To truly understand the entire topic of Technical Analysis, there are a few assumptions to be made. It’s like a scientific theory, where the application depends on certain ideal world conditions to derive a workable model. Technical Analysis has 3 key assumptions which must be made.
#1 All Information Is Discounted Into Price
Every single piece of information is assumed to have been acted upon with a buy or sell in the market.
All information be it fundamental factors, broad macroeconomic factors or the psychology of market participants everything is assumed to have been discounted into the current price of the market you are trading.
Regardless of whether the information is publicly known or not. Hence, by studying price charts alone, we are doing a cumulative study of the effect of the factors of price.
We won’t need to study each factor individually to derive a trading plan for the market. This just leaves the study of price which is a result of the demand and supply forces of the market.
#2 History Repeats Itself
This is in terms of price movement on the charts. These movements represent the psychology of traders which have not changed in the short history of financial speculation.
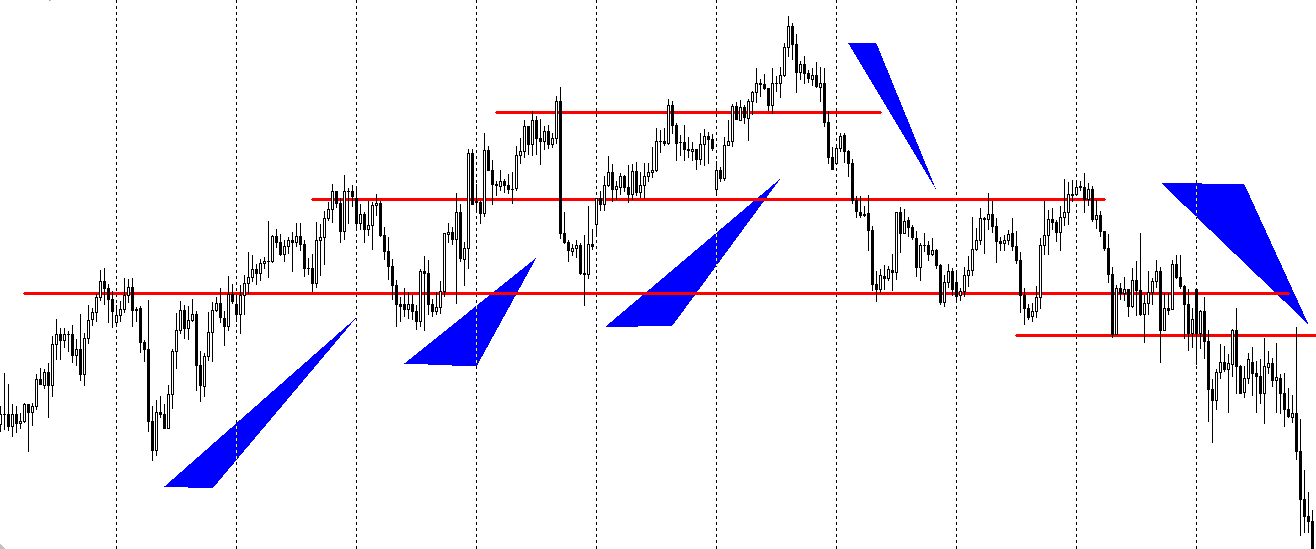
The observed movements were reduced into price patterns. Some of you will be familiar with, such as Head and Shoulders, Flags or Symmetrical Triangles, or even candlestick patterns like Dojis, Engulfings, Evening stars and so on.
These are the price patterns which represent human psychology. True that in recent decades we see more false positives but when you consider these price patterns within a proper trading framework, their effectiveness will still aid you.
#3 Prices Tend To Move In Trends
In other words, trends persist. By identifying the current trend in the market, it is safe to assume that future prices will continue in the same general direction.
A large majority of professional fund managers will rely on this characteristic of the market to produce profits. Swing trading is usually the best way to take advantage of this.
However, it should be noted that trends can be found on all time frames. For example, day traders will be trading the trend for the next 4-6 hours while swing traders will be looking to ride trends for the next few days, or weeks or months even.
So with these assumptions in mind, I hope the study of Technical Analysis will be more enlightening and profitable for you.
Good luck trading in 2016!


2 Responses
Comments are closed.