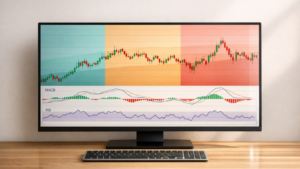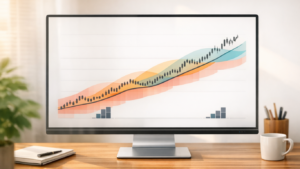
Fibonacci retracement is a trading tool that helps you identify potential price levels where a stock or asset might pause, reverse, or continue its trend. It’s based on the Fibonacci sequence and uses key ratios like 23.6%, 38.2%, 50%, 61.8%, and 78.6% to map out these levels. Unlike moving averages, Fibonacci levels stay fixed, making them useful for planning trades ahead of time.
Here’s the gist:
- What it does: Helps spot support and resistance levels during price corrections.
- Why traders use it: Many traders watch these levels, often leading to predictable price reactions.
- How to use it: Identify swing highs and lows, plot the levels, and look for opportunities to enter or exit trades.
While Fibonacci retracement can be effective, it works best in trending markets and should be combined with other tools like candlestick patterns, volume analysis, or RSI for confirmation. Remember, its success rate is around 37%, so relying on it alone isn’t ideal. Use it as part of a broader strategy to refine your trading decisions.
sbb-itb-466c9b0
How to Plot Fibonacci Retracement Levels
Plotting Fibonacci retracement levels is simpler when you know how to choose the right anchor points. The trick lies in identifying swing highs and lows and applying the tool in the correct direction.
Finding Swing Highs and Swing Lows
Start by looking for swing highs and lows that mark clear market shifts, not minor price movements. To filter out market noise, try using a 3–5 candle rule. A swing high is a point where the high of a candle is higher than the highs of the three to five candles on either side of it. Similarly, a swing low is the lowest point in a group of candles that meet the same criteria. This method ensures your analysis is based on meaningful price movements.
For an uptrend, place the Fibonacci retracement tool at the swing low and drag it to the swing high. In a downtrend, do the reverse – start at the swing high and drag it down to the swing low. Be sure to include the candle wicks, as they reflect the full range of price action. Once you’ve pinpointed these swing points, use your charting platform to plot the retracement levels.
Using Charting Tools
Platforms like TradingView and MT4 make it easy to plot Fibonacci levels with their built-in tools. On TradingView, you can find these under ‘Fibonacci Studies’, while MT4 includes them in the toolbar. MT4 also allows customisation – just right-click on a retracement line and choose ‘Fibo Properties’ to adjust levels as needed.
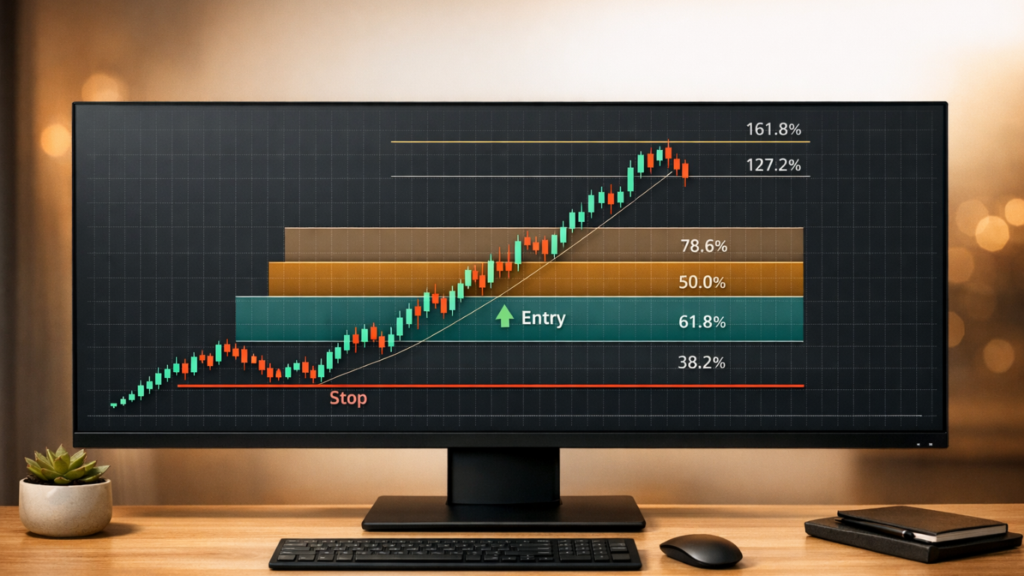
After marking your swing points, the tool will generate key retracement levels (23.6%, 38.2%, 50%, 61.8%, 78.6%) as horizontal lines on your chart.
To improve accuracy, consider a multi-timeframe approach. Start by analysing weekly charts to understand the broader trend, then zoom into shorter timeframes (such as 1-hour or 4-hour charts) to refine your swing points. You can also confirm these points by checking indicators in trading like moving averages, support and resistance zones, or volume spikes.
Using Fibonacci Levels for Entry Signals
Once you’ve plotted Fibonacci retracement levels, the next step is identifying entry points. The reliability of these levels can vary depending on market conditions, so understanding their nuances is key.
Key Entry Levels
- 38.2% Level: This level is ideal for “buy-the-dip” strategies in strong, healthy trends. It indicates a moderate pullback, suggesting the market is pausing before resuming its direction. Traders who missed the initial move often look to this level to join the trend.
- 50% Level: While not a true Fibonacci ratio, the 50% retracement is a psychological midpoint that traders closely watch. Markets often stall or reverse here, making it a popular zone for institutional traders and a reliable entry point.
- 61.8% Level: Known as the “Golden Ratio”, this is one of the most critical levels. It frequently acts as the last major support or resistance before the trend resumes. For example, traders using the 50%-61.8% range in S&P 500 e-mini futures have captured profits as prices returned to previous highs.
- 78.6% Level: This deep retracement level is often seen as the last stand for the current trend. It carries higher risk but offers strong potential rewards. For instance, NVIDIA (NVDA) retraced to the 78.6% level, and traders who entered after confirmation achieved a 2.16 risk-reward ratio by targeting a 127.2% Fibonacci extension at $151.70.
| Level | Market Behaviour | Best Use Case |
|---|---|---|
| 38.2% | Moderate correction | Standard “buy-the-dip” in healthy trends |
| 50.0% | Psychological pause | Midpoint entries; widely monitored |
| 61.8% | Strong reversal zone | Key for major trend continuations |
| 78.6% | Deep retracement | Last defence; higher risk-reward setups |
Confirming Entry Signals with Other Indicators
Fibonacci levels work best when combined with other technical tools. As Investopedia points out:
Fibonacci retracement levels are most effective when used alongside other technical indicators and market analysis, rather than as a stand-alone strategy.
Relying only on Fibonacci levels has a success rate of about 37%. To improve your odds, consider these complementary tools:
- Candlestick Patterns: Reversal patterns like hammers, dojis, or engulfing candles provide visual confirmation. For instance, on a EUR/USD 1-hour chart, a long-legged doji formed at the 61.8% retracement level after the pair moved from a swing high of 1.3364 to a swing low of 1.2523. Traders who entered short after this confirmation captured about 500 pips as the price dropped to the previous swing low.
- Moving Averages: When Fibonacci levels align with moving averages, such as the 50-period or 200-period, it creates a zone of confluence, strengthening the entry signal.
- Volume Analysis: A spike in volume at a retracement level signals strong market participation, increasing the likelihood of a reversal. On the flip side, low volume during a retest might signal weak conviction, raising the risk of a breakout.
- Momentum Oscillators: Tools like RSI, MACD, or Williams %R can highlight overbought or oversold conditions. For example, if RSI rebounds from an oversold level at the 61.8% retracement, it can validate a long entry.
The range between 61.8% and 78.6%, often called the “Golden Pocket”, is considered a high-probability zone for entries. Combining this range with other indicators can lead to precise and informed trading decisions.
Setting Exit Points with Fibonacci Levels
Getting the timing right for exits is just as important as nailing your entries. Fibonacci levels offer a clear framework to help you protect your money and lock in profits in an organised way. This approach pairs well with the entry strategies we discussed earlier, creating a well-rounded trading plan.
Where to Place Stop-Loss Orders
A good spot for your stop-loss is just beyond the next Fibonacci retracement level after your entry. For instance, if you enter at the 38.2% retracement, place your stop-loss slightly past the 50% level. This gives the trade some breathing room for minor pullbacks while still safeguarding your capital.
The 61.8% retracement level is often seen as a critical threshold. If the price breaks past this level, it usually means the setup is no longer valid. A move beyond the 78.6% level often signals a full trend reversal.
Another option is to set your stop-loss beyond the most recent swing high (for short positions) or swing low (for long positions). This approach helps you avoid being stopped out by random market noise, but it does mean you’ll need to take smaller position sizes to manage your risk properly. Also, avoid placing stop-loss orders directly on Fibonacci levels – always add a buffer of 5–10 pips.
Using Fibonacci Extensions for Profit Targets
Fibonacci extensions aren’t just about entries; they’re also great for predicting where a price might head once the trend picks up again. Popular extension levels include 127.2%, 161.8%, and 261.8%. To draw these extensions, use three points: the swing low, the swing high, and the end of the retracement.
The 161.8% level is often a favourite for taking profits during strong trends. However, traders may adjust their targets depending on the trade setup. Take the example of an NVIDIA (NVDA) trade: the stock rose from $75.61 to $140.76, then retraced to the 78.6% level. A trader entering long with a stop-loss at the swing low of $90.65 set their profit target at the 127.2% extension level of $151.70, achieving a risk-reward ratio of 2.16. For trends that blast past the 161.8% level, the next significant targets are often at 200% and 261.8%.
One effective strategy is to scale out of your positions at different extension levels. For example, you could take partial profits at 127.2%, more at 161.8%, and let the rest ride to 261.8%. This approach strikes a balance between managing risk and taking advantage of extended price moves.
Best Practices for Fibonacci Retracement
Using Fibonacci retracement effectively can make a big difference between successful trades and losses.
Selecting the Right Timeframes
When planning entry and exit points, choosing the right timeframes is crucial. Start by analysing a weekly chart to identify the primary trend, then move to daily and intraday charts (such as 1-hour or 4-hour) to refine your trade decisions. Spotting swing points becomes more reliable when confirmed across multiple timeframes. Look for confluence – areas where Fibonacci levels from different timeframes overlap, such as a weekly 38.2% level aligning with a daily 61.8% level. These overlapping zones often signal stronger trading opportunities. Keep in mind, Fibonacci retracement works best in trending markets. In sideways or choppy conditions, its predictive accuracy diminishes.
Combining Fibonacci with Other Technical Tools
Fibonacci retracement levels should always be paired with other technical indicators for better reliability. For example, pay attention to areas where a Fibonacci level aligns with a major moving average, such as the 50-day or 200-day moving average.
Momentum oscillators like RSI or MACD can add further confirmation. For instance, an oversold RSI reading at the 61.8% retracement level might indicate a stronger likelihood of a price rebound. Volume analysis is another useful tool – an increase in volume at a key Fibonacci level often reflects significant institutional activity, while low volume may suggest weak market interest. Additionally, candlestick patterns such as hammers, dojis, or engulfing candles near these levels can provide immediate confirmation for trade entries. Always wait for these secondary signals before committing to a trade.
Master Systematic Trading with Collin Seow
Learn proven trading strategies, improve your market timing, and achieve financial success with our expert-led courses and resources.
Common Mistakes to Avoid
One frequent mistake is inconsistency in selecting swing points. Traders often pick different highs and lows, leading to varying Fibonacci levels and conflicting signals. To avoid this, focus on measuring significant, continuous trends instead of minor fluctuations.
Another error is confirmation bias – forcing Fibonacci levels onto a chart to match a preconceived trade idea can mislead your analysis. As Investopedia explains:
Fibonacci retracement levels are most effective when used alongside other technical indicators and market analysis, rather than as a stand-alone strategy. – Investopedia
It’s also essential to remember that Fibonacci tools don’t consider factors like market timing, volume, or volatility. A price might hit a Fibonacci level without reversing due to external influences or lack of institutional activity. This is why waiting for additional confirmation is critical.
Lastly, only use Fibonacci retracement in clearly trending markets. Without a clear trend, these levels lose their effectiveness. Wait for a defined directional move before drawing your grids, and consider placing stop-loss orders just beyond the next Fibonacci level to account for market noise. Avoiding these common pitfalls can help keep your Fibonacci strategy disciplined and effective.
Conclusion
Fibonacci retracement levels, such as the 38.2%, 50%, and 61.8% zones, act as key areas where prices often pause or reverse. When paired with additional confirmation signals – like candlestick patterns, volume changes, or RSI readings – they help traders make informed decisions by offering clear profit targets and stop-loss points.
To use Fibonacci retracements effectively, identifying swing highs and lows with accuracy is crucial, along with recognising supportive market conditions. As Investopedia highlights:
Persistence and precision can improve the use of Fibonacci levels.
These levels work best in trending markets, where their predictive value is stronger. However, in sideways or choppy conditions, their reliability tends to weaken.
This guide has shown how Fibonacci retracements can be integrated into a broader, rules-based trading strategy. By backtesting setups, waiting for confirmation signals, and analysing multiple timeframes to find areas of confluence, you can use these levels to refine your entry and exit points. When applied thoughtfully, Fibonacci retracements become a dependable tool for improving trade management and overall performance.
FAQs
How do I choose the right swing highs and lows to plot Fibonacci retracement levels?
To use Fibonacci retracement levels effectively, begin by identifying the main trend on a higher timeframe. In an uptrend, pick a clear swing low as your starting point and a swing high as the endpoint. For a downtrend, do the opposite – use a swing high as the starting point and a swing low as the endpoint.
Ensure these swing points are key turning points in the market where the price has noticeably changed direction. This helps your Fibonacci levels align with important support and resistance zones, making it easier to spot potential entry and exit opportunities.
What are the potential risks of using only Fibonacci retracement for trading decisions?
Relying only on Fibonacci retracement can be risky because it doesn’t always account for market volatility or sudden price swings. Misreading retracement levels might result in poor entry or exit decisions, especially if those levels aren’t supported by other indicators.
To reduce risks, it’s smarter to pair Fibonacci retracement with other tools like trendlines or moving averages. Also, factoring in the overall market environment helps provide a clearer picture and lowers the chances of making mistakes.
How can I use Fibonacci retracement with other indicators to improve trade entries?
To improve the precision of your trade entries, try combining Fibonacci retracement levels with other technical tools like support and resistance zones, moving averages, and price action signals. This strategy, known as confluence, helps you spot trading opportunities with a higher probability of success.
Here’s how it works: plot Fibonacci retracement levels on your chart and see if they align with important support or resistance zones or moving averages. When these levels overlap, they highlight a stronger potential entry point. To add more confidence to your setup, watch for price action confirmations such as candlestick patterns or breakouts around these confluence areas.
By using these tools together, you can filter out misleading signals and make better-informed decisions, boosting both the accuracy and confidence in your trades.