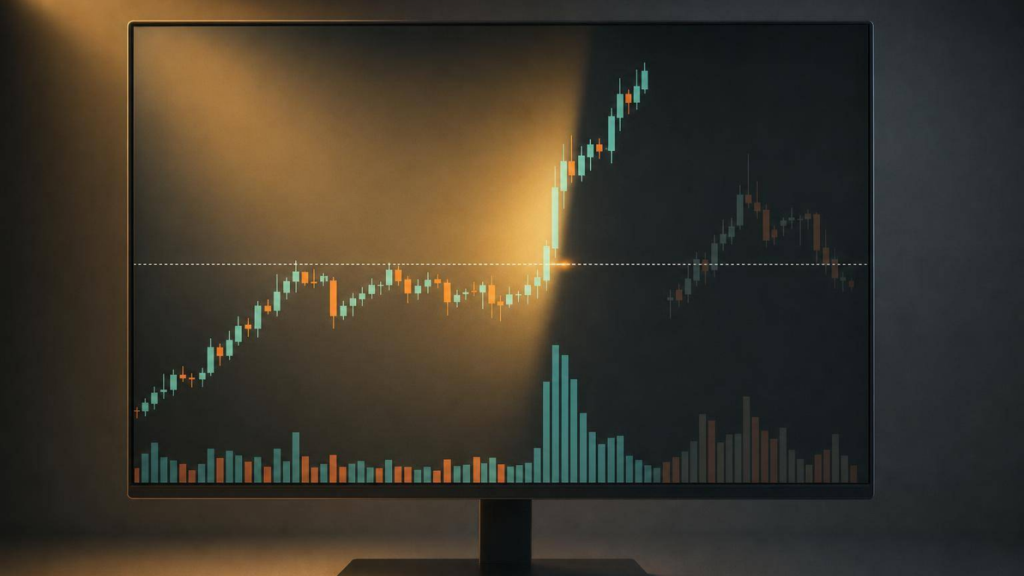
Most breakout trades fail when price cannot stay beyond the level. If I want to tell a valid breakout from a fakeout, I look for five things right away: a strong close beyond the level, 1.5x–2.0x average volume, a retest that holds, alignment with the higher-timeframe trend, and follow-through in the next 1–3 bars. If price snaps back into the old range fast, leaves long rejection wicks, or stalls after entry, I treat it as a warning.
For me, the idea is simple: acceptance vs rejection. A valid breakout tends to stay above resistance or below support, with shallow pullbacks and steady progress. A fakeout tends to poke through, trap traders, and then reverse. That matters even more when I’m sizing risk at only 0.5% to 1.0% of my capital in S$ using fixed ratio or fractional sizing, because repeated false breaks can chip away at both returns and execution.
Here’s the short version:
- Price close: I want a full candle body to close beyond the level, not just a wick through it.
- Wicks: Short wicks suggest less rejection; long wicks hint that the move was pushed back.
- Next bars: A valid move often holds outside the level for 1–3 bars. A fakeout often falls back inside the range within 1–2 bars.
- Volume: I want breakout volume to stand out from the recent norm. Thin volume is a red flag.
- Retest: If price comes back, the old level should hold as new support or resistance.
- Trend context: Breakouts that move with the higher-timeframe trend tend to do better than those fighting it.
- After entry: If there is no follow-through, failure risk goes up. Some tape-reading work puts no-follow-through failures at more than 60%.
sbb-itb-466c9b0
Quick Comparison
| Check | Valid breakout | Fakeout |
|---|---|---|
| Close | Closes clearly beyond the level | Closes at or back inside the range |
| Wick | Short rejection wick | Long rejection wick |
| Next 1–3 bars | Holds outside the level | Reverses back into the range |
| Volume | Around 1.5x–2.0x the 20-bar average | Flat or below average |
| Retest | Holds the flipped level | Fails and cuts back through |
| Trend | Moves with the higher timeframe | Often fights the bigger trend |
| Follow-through | Builds higher highs / lower lows | Stalls, chops, then reverses |
One more stat stands out: breakout entry and exit methods often win only about 30%–40% of the time, while using close and volume filters can lift that to about 55%–65%. So before I take a breakout, I want proof – not just a move through a line on the chart.
Price action: clean break versus rejected move
Once you know what a breakout and fakeout look like, the next step is simple: read candlestick patterns. Start with three things – the close, the wick, and what happens over the next 1–3 bars.
Chart signs of a valid breakout
A valid breakout candle usually has a strong body that closes beyond the level. In a bullish break, the close is near the top of the candle. In a bearish break, it sits near the bottom.
You’ll also see very little rejection at the breakout level. That means the wick on the breakout side is short. Price pushes through and stays there.
Then comes the follow-through. The next 1–3 bars should keep closing outside the level, often with a brief pause or tight consolidation. That’s what you want to see. It shows the market is accepting the new price area, and the old resistance starts acting like support.
Chart signs of a fakeout
A fakeout looks different almost straight away. Price may poke above or below the level during the session, but by the close, it slips back inside the old range.
That failed push usually leaves a long wick and a weak candle body. In plain terms, price tried to break out and got slapped back.
The next bar often confirms the trap. It may fully engulf the breakout candle and push price deeper into the range. If the move reverses within 1–2 bars, that’s a classic fakeout sign.
Here is how the two setups compare side by side:
| Criterion | Valid breakout | Fakeout |
|---|---|---|
| Candle close | Full body closes clearly beyond the level, near the high or low | Wick pierces the level, but body closes at or back inside the range |
| Wicks | Short wicks; little rejection at the breakout level | Long wicks in the breakout direction, showing aggressive rejection |
| Subsequent bars | 1–3 bars continue to close outside the breakout zone | Next 1–2 bars reverse and close back inside the range |
| Reversal speed | Pullbacks are controlled and shallow; level holds | Fast snap-back; breakout candle’s body erased quickly |
| Level flip | Broken resistance flips to support (or vice versa) | Level fails to flip; price trades back inside the old range |
After price action, volume and retest help show whether the move can hold.
Volume and retest: confirmation versus failure
Price action shows the attempt, volume shows participation, and the retest shows acceptance.
How volume supports a real breakout
A breakout with real conviction usually prints with volume that stands out from the recent norm. A useful rule of thumb is 1.5x to 2x the 20-bar average on the breakout candle.
Collin Seow Trading Academy recommends using volume confirmation to screen out false breakouts.
If volume is flat or below average on the first break, take that as a warning sign. Thin breaks can snap back fast because there isn’t much broad participation behind them. Sometimes the move is driven more by stops getting hit, short covering, or thin liquidity than by steady buying or selling pressure.
How retests confirm or weaken the signal
After a breakout, price often pulls back to retest the broken level. A good retest is simple: price breaks a level, comes back to it, and then holds it as new support or resistance. In an upside breakout, old resistance should start acting like support. In a downside breakout, old support should start acting like resistance.
The retest should usually happen on lighter volume, often 30% to 50% below average. That’s a sign the market is accepting the new level instead of rejecting it.
A failed retest looks very different. Price returns to the level, then pushes straight back through it and drops into the prior range again. If that retest comes with rising volume, the failure signal gets stronger. It tells you the other side is stepping in with force.
| Criterion | Valid breakout | Fakeout |
|---|---|---|
| Break volume | 1.5x–2x the 20-bar average; clear volume expansion | Flat, thin, or below-average volume on the break |
| Retest volume | Contracts; often 30%–50% below average | Rises or stays elevated; market pushing back |
| Retest outcome | Holds the broken level as new support or resistance | Cuts back through the level; price returns to the prior range |
Once volume and the retest show acceptance, trend context helps you judge whether the move still has space to run.
Trend context and follow-through after entry
Once volume and the retest show that the market has accepted the move, the next question is simple: does the trend give the breakout space to keep going?
Trend alignment before entry
Breakouts that move with the higher-timeframe trend tend to hold up better. If you trade against that bigger trend, failure is more common.
A simple way to handle this:
- Check the higher timeframe first
- Then move to your execution chart
- Define the higher-timeframe trend before taking any lower-timeframe breakout
- Only take the breakout if it moves in the same direction
That top-down check matters. It helps you avoid taking a lower-timeframe signal that looks good for a moment but runs straight into the bigger market flow.
Range-bound markets are a different story. When price swings back and forth without a clear pattern of higher highs or lower lows, trouble tends to show up fast. Candles start to overlap, moving averages flatten out, and false breaks pop up more often. In that kind of market, price can poke above or below a level and then snap right back. An ADX reading above 25 usually points to a trend with better odds of follow-through.
Master Systematic Trading with Collin Seow
Learn proven trading strategies, improve your market timing, and achieve financial success with our expert-led courses and resources.
What follow-through should look like
After a valid upside breakout, price should keep building higher highs and higher lows. It should also stay above the broken resistance for several bars or sessions. Small pullbacks are normal. What you want to see is that those pullbacks stay shallow and get bought fairly fast.
For a downside breakout, the same idea applies in reverse. Price should print lower lows and lower highs while staying below the old support. If price bounces back to retest the breakdown area, that bounce should stall and roll over. In other words, it should form a lower high instead of climbing back into the old range.
Early warning signs of failure after entry
The biggest warning sign is an immediate reversal after entry. On an upside breakout, that often looks like a quick push above resistance followed by hard selling, with price closing back below the level in the same bar or session. On a downside breakout, the flip side is a sharp jump back above former support on strong buying.
Two other danger signs are worth watching:
- Price starts chopping sideways near the breakout level instead of building fresh highs or lows
- The next one to three candles fail to push the move any further
Both patterns suggest the breakout didn’t have real participation behind it. Tape-reading research suggests that no follow-through – where price briefly clears a level but then shows lighter order flow and no fresh buying – fails in more than 60% of cases.
Collin Seow Trading Academy also stresses multi-timeframe trend alignment in their 7 sacred rules of trading.
Conclusion: key differences to focus on
After price action, volume, retest, trend, and follow-through, the question is simple: does the move still look like a valid breakout, or is it slipping into fakeout territory?
Treat the checklist as a single test, not a set of random signals:
- Clean candle close beyond the level
- Volume confirmation at 1.5–2× the 20-bar average
- Retest that holds the new support or resistance
- Higher-timeframe trend alignment
- Follow-through with shallow pullbacks, not a fast return into the range
When these factors line up, the odds get better in a meaningful way. Research across instruments and timeframes shows that raw, unfiltered breakout entries succeed only around 30–40% of the time. Add close confirmation and volume filters, and that figure can climb to 55–65%.
If even one filter looks weak, the setup deserves less trust. No single signal can do the whole job on its own. The checklist works best when you use it as a complete screen, with each part either adding confidence or waving a red flag.
Put these signals into written trading rules so you remove guesswork. Decide how far price must close beyond a level, what volume threshold counts as confirmation, and where your stop goes if the retest fails.
Don’t trade every breakout. Trade the ones with the clearest proof. And if that proof falls apart, get out fast. That’s the difference between a breakout and a fakeout: acceptance versus rejection.
FAQs
How do I mark a breakout level correctly?
Treat support and resistance as zones, not razor-thin lines. A price level is rarely that neat in live markets. Start by marking the main swing highs and lows on a higher timeframe, because those levels usually matter more.
Don’t jump at every intraday spike or wick. That’s where traders often get faked out. Instead, wait for a clear close beyond the zone. A good rule of thumb is a candle body that makes up at least 50% of the total range, with volume at around 1.5 to 2.0 times the 20-day average.
Can a breakout still work without a retest?
Yes, but it comes with more risk.
Some traders jump in on the first price move to catch momentum. That can work. But a retest gives you extra confirmation that the new support or resistance level is actually holding.
Without a retest, you lose a handy signal that helps filter out fakeouts. If you still decide to enter, look for strong volume and a clear close beyond the level.
Which timeframe is best for spotting fakeouts?
There’s no one-size-fits-all timeframe. It comes down to your trading style and whether you’re able to watch the market during SGX trading hours.
For most traders in Singapore, a higher timeframe like the 4-hour or daily chart tends to be more reliable when you’re checking for a close above resistance. Shorter timeframes, such as 1-minute to 15-minute charts, can still be useful for quick entries. The trade-off? They’re usually much noisier and can throw up more false signals.