About the Stock (NASDAQ: MSFT)
Microsoft Corporation is an American multinational technology conglomerate headquartered in Washington.
From the initial days of providing computer operating software like Windows, the company has expanded to internet services, cloud computing, artificial intelligence, gaming, and other businesses, including collaborations with governments and enterprises.
Stock background:
Last week’s solid jump suggests the worst could be over in Microsoft shares.
Microsoft shares soared 22% last week after the Q4 earnings beat expectations. The company reported 43% growth at its key Azure cloud business, surpassing expectations. More importantly, the company assured investors that its massive capital investment in AI is now beginning to produce profitable growth.
Concerns regarding the company’s capital expenditure and return on artificial intelligence (AI) infrastructure amid competition from other AI agents have weighed on the stock in recent months. Last week’s forward guidance is perceived to be quite reassuring for investors.
About a month ago, this column explored the idea of some dollar-cost averaging in Microsoft shares. See “Microsoft Corp: Change to Capitalize on the Decline,” dated July 6. That idea is off to a solid start!
Technical Analysis on Microsoft Corporation (NASDAQ: MSFT)
On technical charts, Microsoft has rebounded from major support converged support – the April 2025 low, the November 2021 high, coinciding with an uptrend line from 2020.
This support is strong, and a break below would have had severe bearish implications for the stock.
MSFT (Weekly):
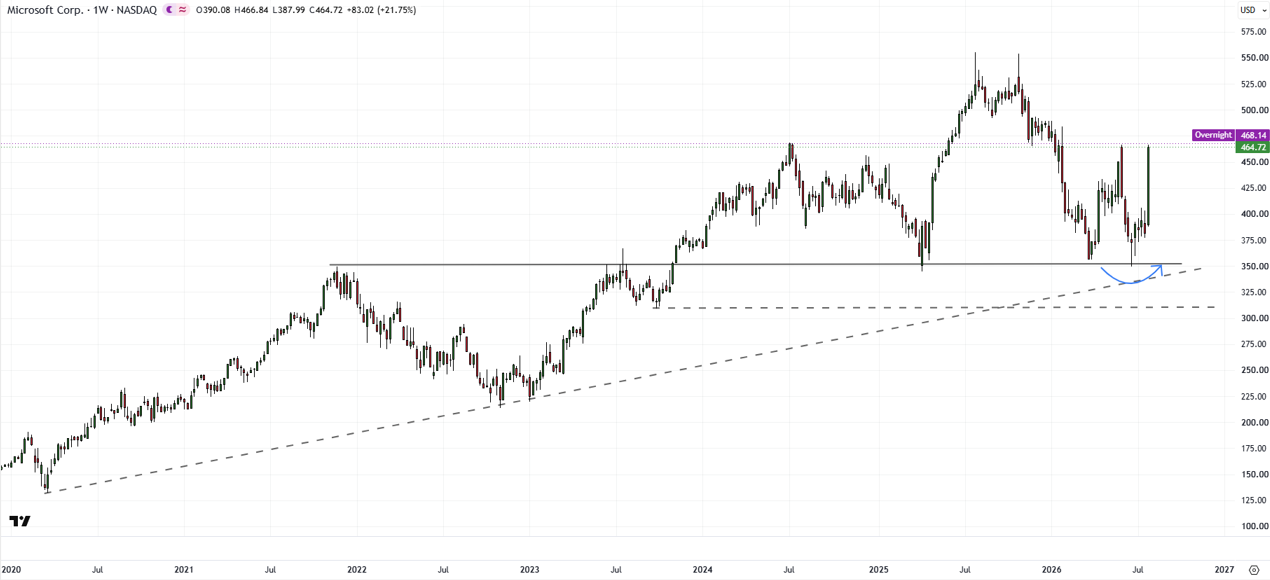
However, the hold above the vital cushion, coupled with the 22% rebound last week, is a sign that the worst could be over for Microsoft shares.
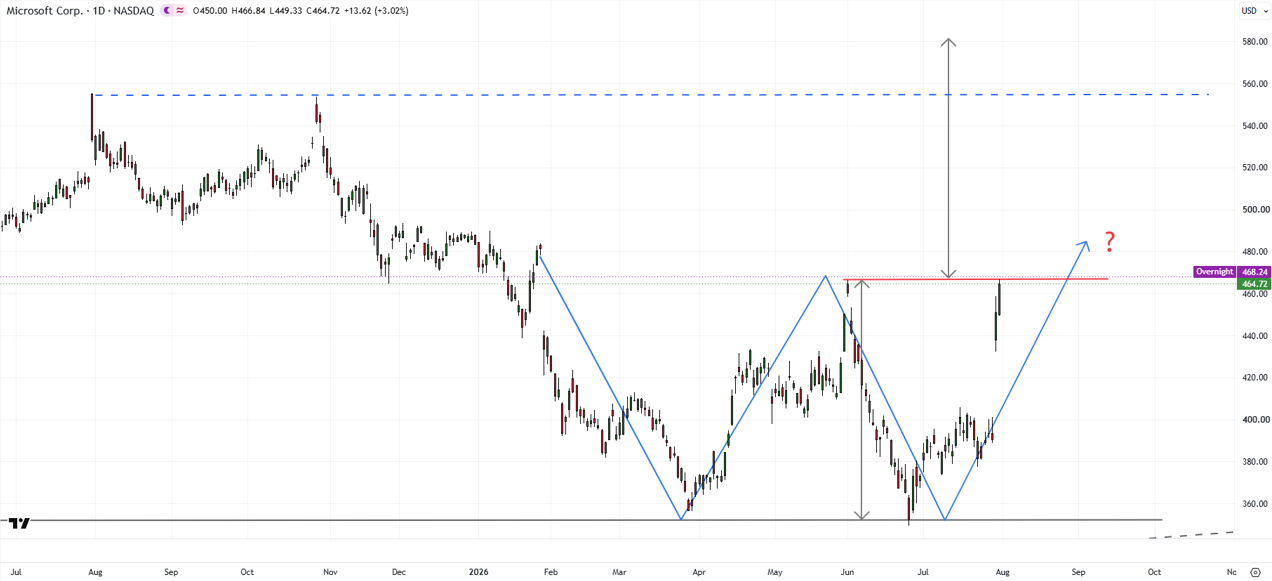
It is now testing key resistance at the June high of 466. Any break above would trigger a major double bottom (the March 2025 and the June 2025 lows), pointing to a potential rise toward the 2025 record high of 555.
MSFT (Weekly):
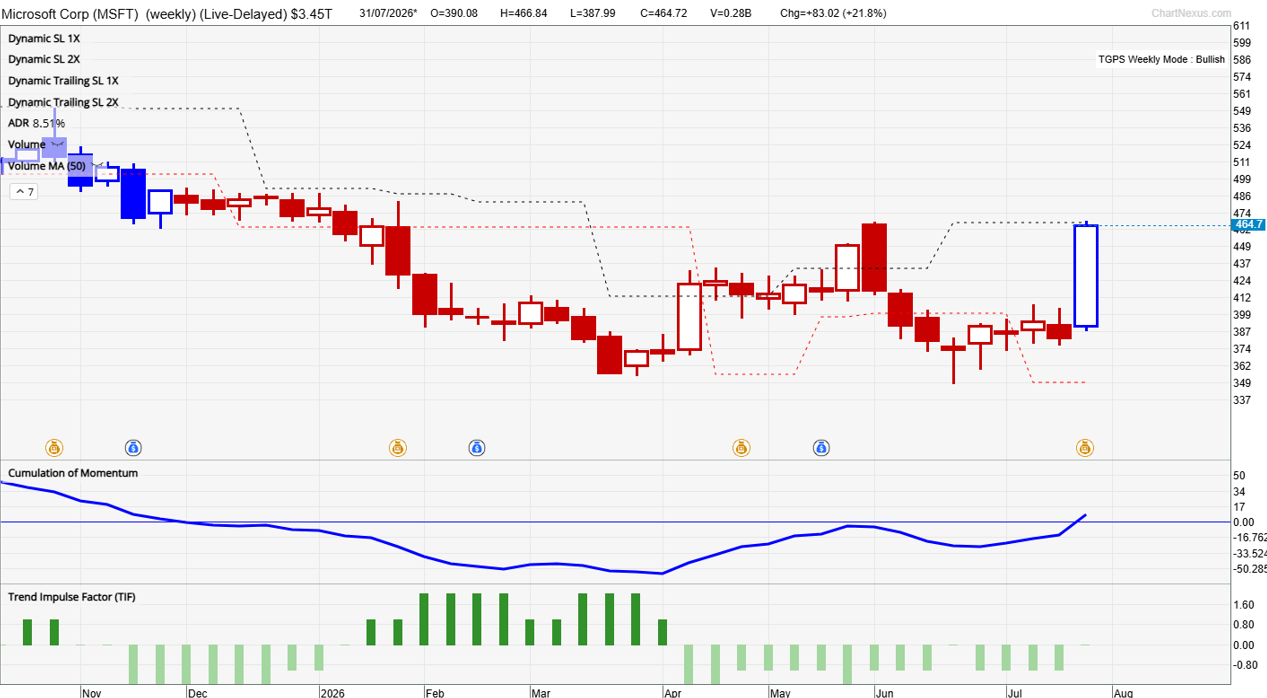
Our TradersGPS (TGPS) system has given a green signal for a trend change. As per the system Red candles indicate the trend is down, Blue candles indicate the trend is up.
Regular followers of this blog would know that the system is essentially a trend-following model. As the accompanying chart shows, the system was able to capture the downtrend very well – the candle color changed to Red at the end of December 2025. The stock had maintained a weak bias until last week.
Last week, Microsoft shares were one of the top-performing stocks. On the weekly chart, the candle colour changed to Blue – the first time since 2025.
MSFT (Weekly):
Trading strategy:
The idea initiated a month ago, “Microsoft Corp: Change to Capitalize on the Decline,” dated July 6, is now in the money. It is tempting to take some cash off the table, given last week’s spectacular gains. However, patience is key given the horizon is long-term (>3 years).
TGPS subscribers can go on to the Daily chart for entry signals if they had been waiting for the candle colour to turn Blue on the weekly chart.
For those who are long the stock on the structural bullish story of Microsoft/Windows, holding the stock in adverse times seems to be paying off – the stock has retraced half of its decline.
What is the risk that the stock doesn’t turn lower again?
Sure, that is entirely plausible. However, the probability seems to be low for the above-mentioned reasons.
Moreover, long-term trend indicators, like the 200-week moving average, continue to slope upwards, suggesting that the broader bullish outlook remains intact. As a result, even if the stock were to turn lower again, the decline could well be short-lived.
However, as always, I could be wrong!