About the Stock (NASDAQ: MSFT)
Microsoft Corporation is an American multinational technology conglomerate headquartered in Washington. From the initial days of providing computer operating software like Windows, the company has expanded to internet services, cloud computing, artificial intelligence, gaming, and other businesses, including collaborations with governments and enterprises.
Stock background:
Microsoft shares have underperformed its peers, losing more than 30% from its 2025 peak. Concerns regarding the company’s capital expenditure and return on artificial intelligence (AI) infrastructure amid competition from other AI agents have weighed on the stock in recent months.
However, the generational growth story, particularly of the Windows operating system, Microsoft Office tools, and cloud services, makes one wonder whether the stock can sustain the decline since last year.
The last quarterly results beat market estimates on the top and bottom lines, suggesting its key growth engines remain intact.
The company said it expects to spend $190 billion in capital spending this calendar year, exceeding analysts’ expectations, due to rising costs of memory chips. This appears to be the one key factor that is unsettling investors. Investors will be watching whether the revenue growth justifies the massive investment in AI.
In the meantime, software stocks, including Microsoft, could turn out to be a beneficiary of the rotation out from chip stocks recently.
Technical Analysis on Microsoft Corporation (NASDAQ: MSFT)
On technical charts, Microsoft is once again retesting major support converged support – the April 2025 low, the November 2021 high, coinciding with an uptrend line from 2020. The pivot level has been tested thrice in the past and has withstood the test of time.
This time around, it wouldn’t be surprising if the support manages to hold, especially given the 35% decline from its July 2025 peak of 555.
MSFT (Weekly):
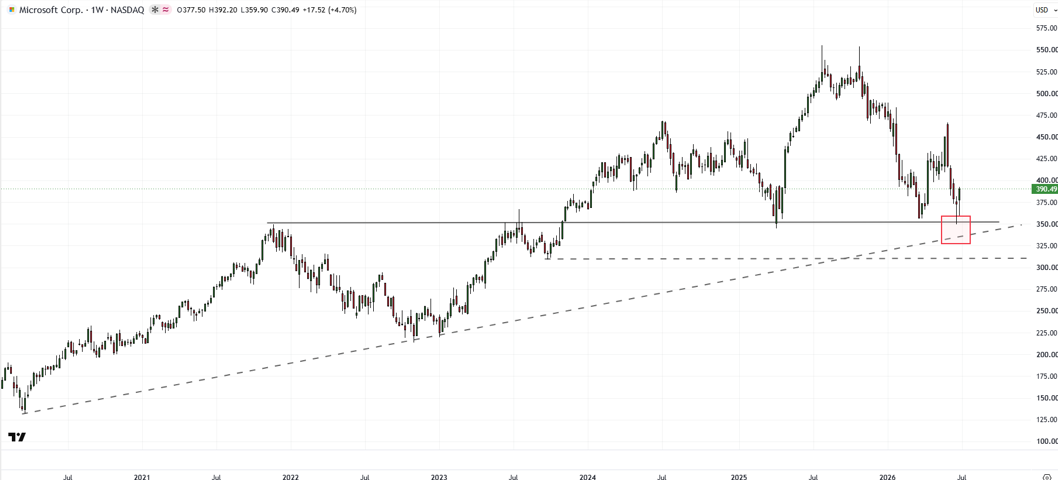
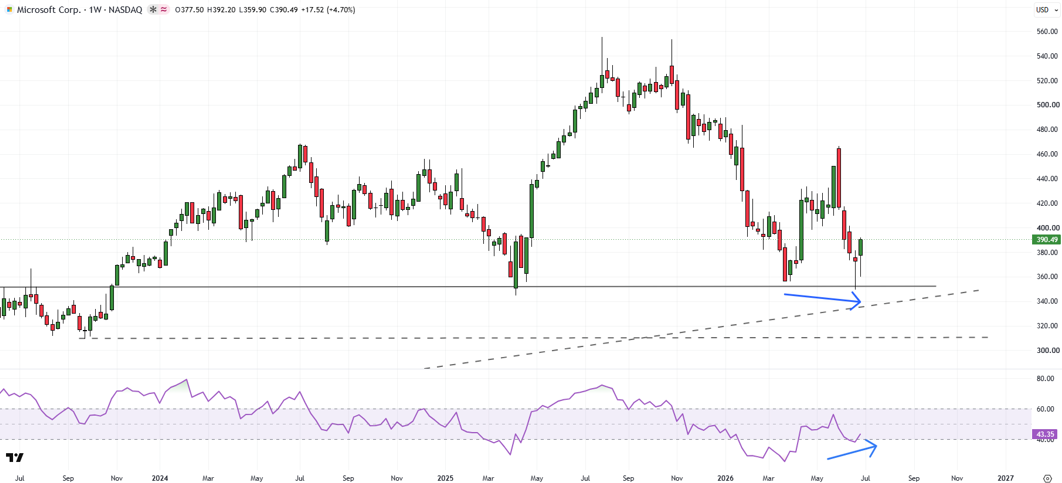
While the price action is still unfolding, two pieces of evidence suggest this time may not be different. That is, there is a growing chance that Microsoft shares could rebound.
Firstly, positive momentum divergence on the weekly chart (higher lows in the 14-week Relative Strength Index associated with lower lows in price) shows that the slide is losing steam. Secondly, the doji candlestick last week at the vital support area suggests bears are not convinced, at least yet, that the price could go lower.
MSFT (Weekly):
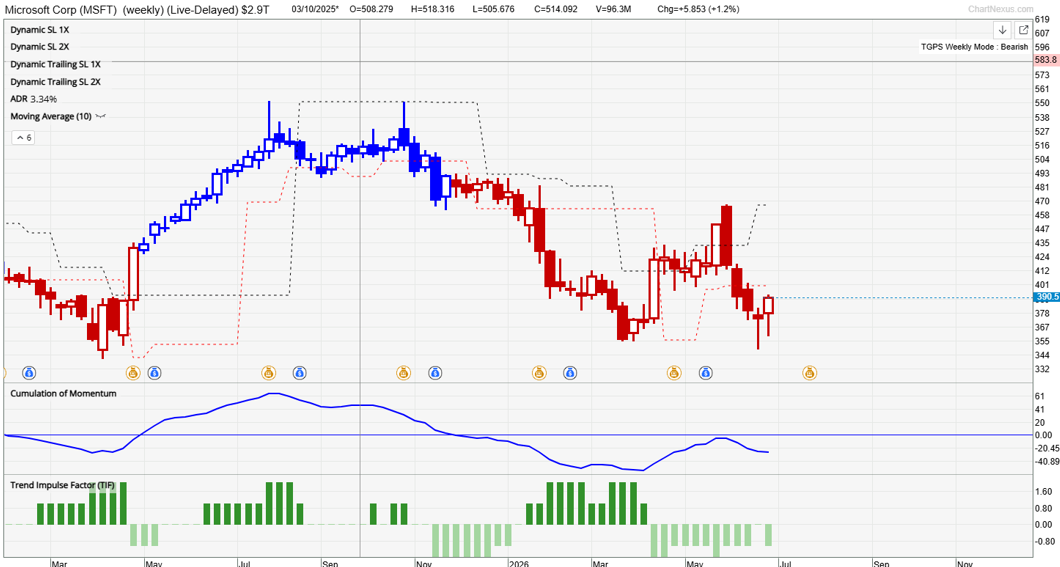
Our TradersGPS (TGPS) is yet to give a confirmation of a trend change. Regular followers of this column would know that, as per the system, red candles indicate the trend is down, and blue candles indicate the trend is up.
As the accompanying chart shows, the system was able to capture the downtrend very well. The candle colour changed to Red on the weekly chart at the end of last year.
MSFT (Weekly):
Any trading strategy?
I would be inclined to dollar-cost average around current levels for the above-mentioned reasons. Granted, there is no confirmation that the stock has bottomed.
But this is not a trade where the position can be price sensitive. This is more for long-term (3 years and above), given the stock has lost 1/3rd of its value since its peak. However, I could be wrong.
Cautious investors might want to wait for the candle colour to turn Blue on the weekly chart before looking at the stock constructively.
For those who are long the stock, I would reckon it would make sense to hold it given the bullish structural story of Microsoft/Windows.
What is the risk?
This week’s hold above the horizontal trendline support at 350 could be a pause rather than a reversal. In such a case, any break below 350 would accentuate downside risks.
The next support comes in at the September 2023 low of 310. Significant support below 310 comes in at the October 2022 low of 210.