Geopolitical Developments and Oil Price Reaction
US equities rebounded after President Donald Trump said the US and Iran have held talks to end the hostilities in the Middle East.
Does this mean the low for markets is in place? Probably not.
Oil prices fell sharply on hopes that normal operations would resume at the Strait of Hormuz if negotiations turn out to be fruitful. However, Iran has denied any talks with the US.
How the situation in the Middle East unfolds remains uncertain, and predicting geopolitics can be tricky. Instead, an assessment of the price action can provide some clues.
Price Action Analysis
The S&P 500 index opened higher with a gap on Monday following reports of US-Iran talks, but gave up much of the day’s gain toward the close. On technical charts, yesterday’s price action formed a bearish inverted hammer candlestick pattern.
It is always an encouraging sign for bulls to have a higher open followed by a stronger close, reflecting the market’s conviction. A higher open followed by the inability to see follow-through gains often lends the rebound as suspect.
That is, the index was deeply oversold, and the positive news flow proved to be a catalyst for some position readjustments.
S&P 500 (Daily):
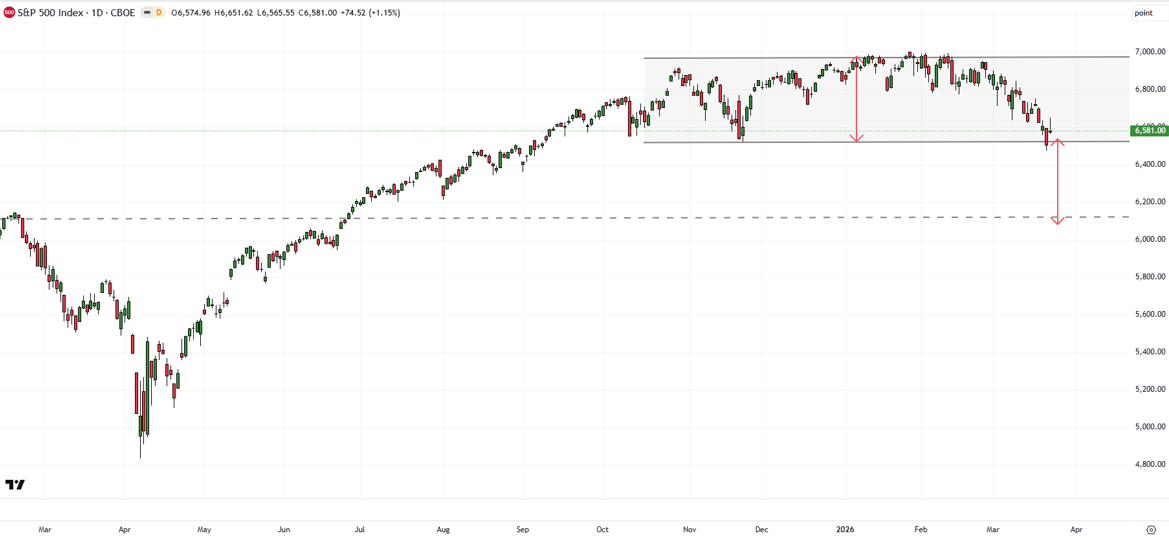
To be fair, the price action is unfolding – it could still be a case where the follow-through gains are spread across a number of days, instead of gains in one session. For the rebound to have legs, the index needs to, at a minimum, break above the March 17 high of 6700.
Until then, the path of least resistance remains sideways to down.
S&P 500 Index (Weekly):
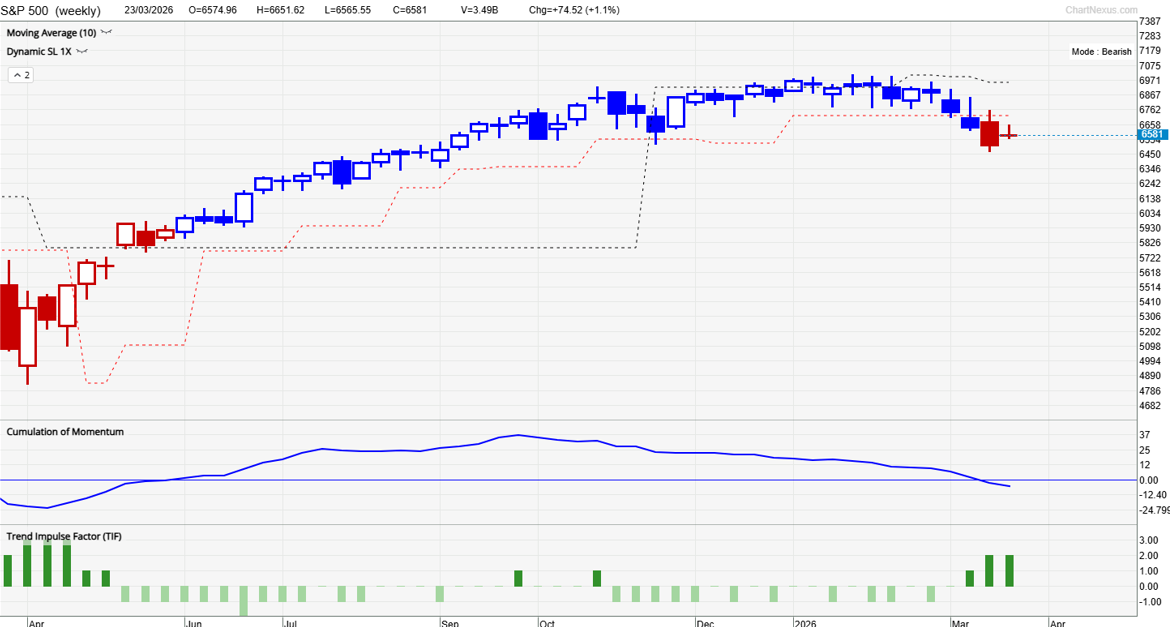
Meanwhile, our proprietary system TradersGPS (TGPS) has flashed a bearish signal – the candle colour turned Red on the Weekly chart for the first time since June 2025.
However, as per our system, we would wait for a close below last week’s low to confirm that the trend had indeed changed to bearish. Blue coloured candles indicate the trend is Bullish; Red coloured candles indicate the trend is Bearish.
S&P 500 (Weekly):
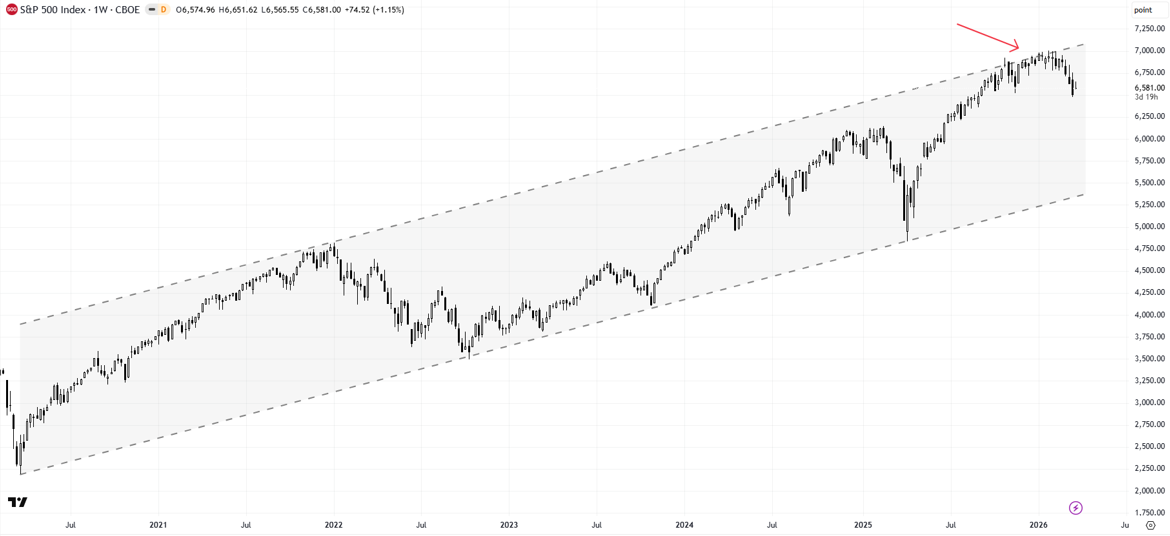
Signs of fatigue had emerged even before the conflict in the Middle East began at the end of February, as the weekly chart with the rising channel shows.
Early February, we had highlighted the risk of a retreat in the S&P 500 (“US Equities: Possibility of a Minor Correction,” dated 6 February 2026).
While the weak outlook seems to be playing out, a break below the October low of 6550 is needed to confirm that an interim top is in place. Such a break could pave the way toward the early-2025 high of 6150.
On the upside, a break above 6700 would be an early sign that downside risks had faded, raising the probability of a test of the January high of 7002.
FAQ
Is the recent rebound in US equities sustainable?
The rebound lacks strong follow-through, suggesting it may be driven by short-term positioning rather than a confirmed trend reversal.
What technical signal is warning of weakness?
A bearish inverted hammer candlestick pattern on the daily chart indicates potential downside risk after the rebound.
What level must the S&P 500 break to confirm strength?
The index needs to break above 6700 to signal that downside risks have faded.
What does TradersGPS indicate for the S&P 500?
The weekly TradersGPS signal has turned bearish for the first time since June 2025, suggesting weakening momentum.