As the calendar year 2025 draws to a close, the rally in US equities could be due for a breather.
US equities have had a spectacular year, up over 40% since April, which saw a 20% drawdown led by trade worries. US earnings have been a top driver, up double digits for the past four consecutive quarters despite tariff-related uncertainties.
In addition, US tariff deals with its key trading partners reduced worries of an imminent recession, just as the US Federal Reserve started to ease monetary policy.
However, doubts regarding a rate cut in December, prolonged US government shutdown, and concerns regarding the valuations in AI-dominated stocks have taken some heat off the rally in US equities.
Near-Term Risks: December Cut Doubts, Shutdown Overhang, AI Valuations
At the October meeting, the Fed cut its benchmark interest rate by 25 basis points to 3.75%-4.0%. Fed Chair Jerome Powell cautioned against assuming that a December interest rate cut was a done deal. Odds of a December Fed rate cut have reduced significantly to around 50% from 95% a month ago.
While the US jobs market has softened, inflation has been above the Fed’s target, raising doubts regarding continued easing. The delay in the release of key US economic data as a result of the US government shutdown has added to the uncertainty.
With the US government shutdown now over for now, focus will shift to macro data, which will shed light on the path of monetary policy.
AI has been a dominant theme for markets, with nearly $400 billion in AI-related spending across major technology companies. The S&P 500 Information Technology sector continues to overshadow other sectors with consistent earnings beats.
Having said that, a spectacular rally in 2025 and year-end positioning adjustments could trigger a minor retreat.
S&P 500 (Weekly):
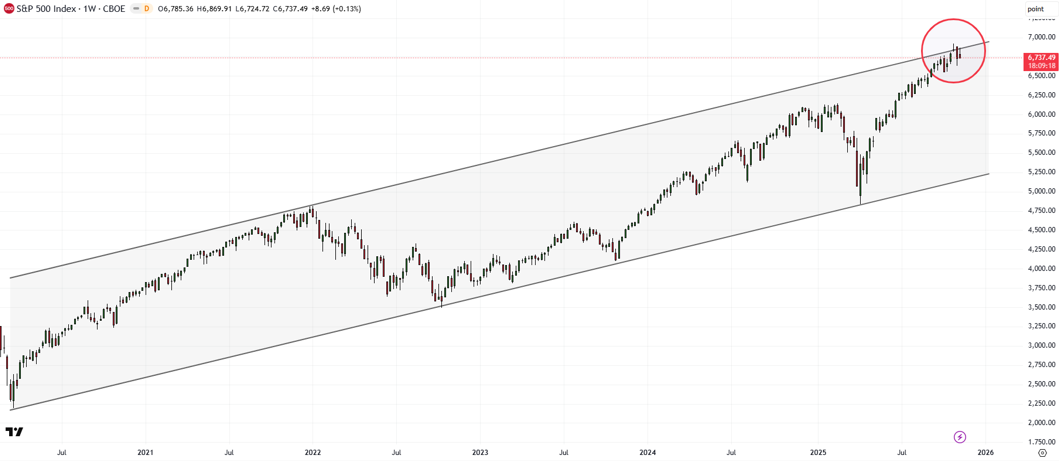
On technical charts, the S&P 500 index faces tough resistance on the upper edge of a rising channel from the Covid-19 low. A minor setback wouldn’t be surprising in the near term.
S&P 500 (Daily):
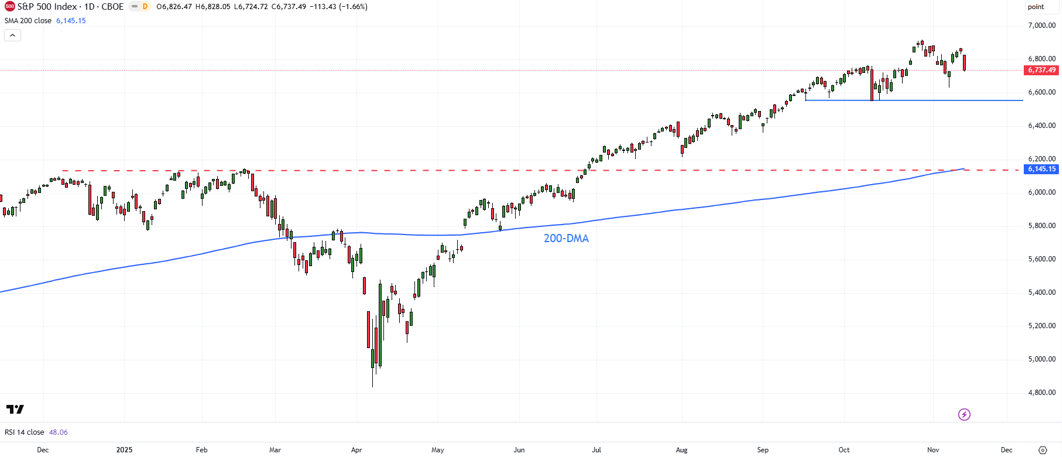
A further retreat could push the index toward quite strong support at the October low of 6550. This could restrict the retreat, but any break below could pave the way toward major support on the 200-day moving average, coinciding with the early-2025 high of 6150.
Unless the index cracks below the lower edge of the channel from 2020 (as highlighted in the weekly chart above), the long-term uptrend would remain intact. On the upside, a bullish break above the channel could pave the way initially toward the psychological 7000 mark, potentially 7500 in the coming months.
S&P 500 Index (Weekly):

TGPS Read: Bullish Bias on Daily and Weekly Timeframes
Our proprietary system, TradersGPS (TGPS), remains Bullish on the S&P 500 index on the daily and the weekly charts. Blue coloured candles indicate the trend is Bullish; Red coloured candles indicate the trend is Bearish. As the chart shows, the weekly candle colour is not as sensitive to near-term gyrations in the market.
Unless it turns out to be a major correction, the broader trend is unlikely to change.
FAQ
Why might the US equity rally pause into year-end?
After a strong run driven by earnings, easier policy, and tariff progress, rising valuation concerns and event risk suggest a short-term breather.
What did the Fed decide at the October meeting?
The Fed cut rates by 25 basis points to a target range of 3.75%–4.0% and signalled caution on assuming a December cut.
How have December rate-cut odds changed?
Implied odds have cooled to around 50%, down from about 95% a month earlier.
What is the TradersGPS (TGPS) signal showing?
TGPS remains Bullish on daily and weekly charts; the weekly view is less sensitive to short-term swings.