When trading intraday reversals, managing your entries and exits is key. Fibonacci tools help you identify these turning points using precise mathematical levels.
Here’s how you can use them effectively:
- Identify the Trend: Always start by confirming the primary trend on higher timeframes (e.g., 4-hour or daily charts). Draw Fibonacci retracements from swing lows to highs (uptrend) or highs to lows (downtrend).
- Draw Fibonacci Levels: Anchor Fibonacci levels accurately to recent swing points. Focus on 38.2%, 50%, and 61.8% retracement levels as these often act as support or resistance.
- Look for Confluence: Combine Fibonacci levels with other indicators, like moving averages, trendlines, or candlestick patterns, to strengthen your analysis. Confluence zones are more reliable for reversals.
- Wait for Confirmation: Use tools like RSI, MACD, or volume spikes to confirm momentum shifts near Fibonacci levels. Candlestick patterns like Doji or Engulfing also provide strong reversal signals.
- Set Stop-Loss and Take-Profit: Place stop-losses just beyond the next Fibonacci level to limit risk. Use Fibonacci extensions (e.g., 100%, 161.8%) to set realistic profit targets.
Step 1: Identify the Primary Trend
Before diving into Fibonacci retracements, you need to pinpoint the primary market trend. This step is essential because it ensures your analysis aligns with the overall market direction, which can significantly boost the reliability of your reversal predictions. In an uptrend, draw retracements from swing lows to swing highs, while in a downtrend, the reverse applies – from swing highs to swing lows.
Skipping this step and applying Fibonacci tools without first identifying the trend can lead to misleading results. The mathematical accuracy of Fibonacci levels only holds value when used in the correct directional context.
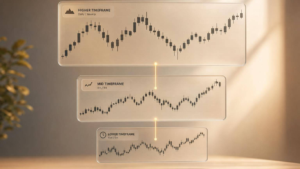
Use Higher Timeframes for Trend Confirmation
When it comes to confirming the market trend, higher timeframes are your best guide. Even if you’re trading on 5-minute or 15-minute charts, looking at broader timeframes like 1‑hour, 4‑hour, or daily charts offers a clearer picture of the market’s overall direction.
To begin, open your trading platform and switch to the 1‑hour chart for the instrument you’re trading. Look for distinct swing highs and swing lows over the last few sessions. For instance, if you’re trading SGX-listed stocks like DBS Group Holdings or Singapore Airlines, check whether the price action shows a pattern of higher highs and higher lows (indicating an uptrend) or lower highs and lower lows (signalling a downtrend).
Most trading platforms come equipped with automated tools to help you identify swing points and plot Fibonacci levels. While these tools are convenient, manually identifying these levels can deepen your understanding of market structure and trends.
The 4‑hour chart often strikes the perfect balance for intraday traders. It filters out the noise of shorter timeframes while still being responsive enough to highlight significant trend changes within a single trading day. If the 4‑hour chart confirms an uptrend, pullbacks on your intraday charts become potential buying opportunities at Fibonacci retracement levels.
Once you’ve confirmed the broader trend, you can shift your focus to the finer details of recent price movements.
Focus on Recent Price Action
After establishing the overarching trend, it’s time to zoom in on recent price action to catch intraday shifts. Markets can move swiftly, especially during earnings reports, economic updates, or geopolitical events that impact Singapore’s financial landscape.
For intraday analysis, recent price action typically refers to the last 3–5 trading sessions. This timeframe provides the most relevant insights into current market conditions. Pay close attention to the latest swing points within the current trading week.
For example, observe how the price reacts around key support and resistance levels. If the STI Index futures have consistently rebounded from the S$3,200 level in the past three days, this reinforces the level’s importance more than a bounce that occurred weeks ago.
Many traders now combine Fibonacci analysis with other tools like moving averages or trendlines to improve accuracy. The Collin Seow Trading Academy, for instance, advocates a multi-layered approach, teaching traders to blend technical indicators, market trends, and sentiment analysis. This strategy includes monitoring market cycles, understanding investor behaviour, and leveraging combination screeners to spot strong stocks ready for potential gains.
When evaluating recent price action, avoid applying Fibonacci retracements in choppy or sideways markets. Clear trends produce more reliable retracement signals. If the market has been moving sideways with no clear direction over the past few sessions, it’s better to wait for a trend to emerge. This is especially relevant in Singapore’s market, which can experience consolidation during low-volume periods or in anticipation of major announcements from the Monetary Authority of Singapore.
Step 2: Draw Fibonacci Retracement Levels
Once you’ve identified the primary trend, the next step is to draw Fibonacci retracement levels accurately. This helps you identify potential reversal zones, which can be critical for spotting profitable opportunities and avoiding missed chances.
How to Anchor Fibonacci Levels Correctly
To get meaningful retracement levels, you need to anchor them properly based on the trend identified earlier. Here’s how:
- In an uptrend, draw the Fibonacci retracement from the most recent significant swing low to the most recent swing high. This captures the market’s movement from the lowest point to the highest point. For instance, if you’re analysing CapitaLand Investment on a 15-minute chart and observe the stock rising from S$3.15 to S$3.28 during the morning session, you would anchor your Fibonacci tool from S$3.15 (low) to S$3.28 (high).
- In a downtrend, reverse the process. Draw from the most recent swing high to the most recent swing low. This maps the market’s move from the peak to the trough. For example, if Singapore Airlines drops from S$6.45 to S$6.22 during the afternoon, your Fibonacci retracement would span from S$6.45 (high) to S$6.22 (low).
Always use swing points formed in the current or previous session, as older points might not reflect the current market sentiment.
Be careful to avoid common mistakes when anchoring Fibonacci levels. Focus on clear, visually prominent highs and lows on the chart, rather than minor price fluctuations that can lead to misleading retracement levels. Also, avoid applying Fibonacci tools to choppy, sideways price action where no clear trend is present.
As the market evolves, update your Fibonacci levels. For instance, in an uptrend, if the price surpasses the previous high, redraw the retracement levels to reflect the new swing high. This ensures your analysis stays relevant and adapts to the latest market structure.
Once your Fibonacci levels are set and updated, you can start monitoring the key retracement levels for potential reversals.
Key Levels to Watch
When it comes to intraday reversals, three Fibonacci retracement levels stand out: 38.2%, 50%, and 61.8%. Each level provides insights into market behaviour and reversal probabilities.
- 38.2% Retracement Level: This is often the first level where pullbacks might pause or reverse. According to Zerodha Varsity, it tends to produce minor reversals or bounces, especially in strong trends. For instance, in an uptrend, watch for signs of buying interest at this level, while in a downtrend, look for selling pressure.
- 50% Retracement Level: Although not a Fibonacci ratio, this level holds psychological importance in technical analysis. Historically, markets often pause or reverse at this midpoint, particularly during moderate corrections.
- 61.8% Retracement Level: Known as the “golden ratio”, this is the most closely watched level among traders. It often signals deeper pullbacks and has the highest potential for strong reversals. A 2021 study even found this level to be the most reliable for reversals in intraday trading scenarios.
| Fibonacci Level | Typical Market Behaviour | Reversal Strength |
|---|---|---|
| 38.2% | Minor bounces, shallow corrections | Low to Moderate |
| 50.0% | Psychological support/resistance | Moderate |
| 61.8% | Deep pullbacks, strong reversals | High |
These levels often act as support and resistance zones, where prices may reverse or show significant reactions. However, Fibonacci retracement works best in trending markets, helping you identify potential reversal zones during pullbacks.
If you’re trading in Singapore, make sure your platform is set up to display prices in SGD (S$) and uses local number formatting, such as 3,238.50 for three thousand two hundred and thirty-eight dollars and fifty cents. This ensures clarity when recording trades or sharing your analysis with other traders in the region.
Fibonacci levels tend to be more reliable in liquid markets with clear trends. Stocks listed on the SGX, STI Index futures, or other actively traded securities are more likely to respect these levels compared to thinly traded counters.
Step 3: Look for Confluence with Other Indicators
Once you’ve identified Fibonacci levels, pairing them with other indicators can make your analysis more reliable. While Fibonacci retracement levels highlight potential reversal zones, their accuracy improves significantly when used alongside other technical tools. In fact, a 2021 study revealed that combining Fibonacci retracements with additional indicators enhanced the accuracy of intraday reversal predictions compared to using Fibonacci alone. This technique, called confluence analysis, helps weed out false signals and strengthens your trading strategies.
Confluence occurs when multiple indicators point to the same conclusion. For instance, if a Fibonacci level aligns with a moving average, trendline, or candlestick pattern, it creates a high-probability zone where reversals are more likely. Below, we’ll explore how moving averages and trendlines can complement Fibonacci retracements.
Combine Fibonacci with Moving Averages or Trendlines
Moving averages and trendlines are excellent tools to use alongside Fibonacci levels, forming robust confluence zones that often act as strong support or resistance areas.
Moving averages are particularly effective when paired with Fibonacci retracements because they represent dynamic support and resistance. The 20-period, 50-period, and 200-period moving averages are especially useful when analysing intraday charts. If a Fibonacci retracement level coincides with one of these moving averages, the zone becomes far more dependable.
For example, imagine studying a 15-minute chart of DBS Group Holdings. If the 61.8% Fibonacci retracement level at S$35.42 aligns closely with the 50-period moving average at S$35.40, this overlap creates a powerful confluence zone. This alignment suggests that both technical and mathematical factors support a potential reversal at that price.
Trendlines add another layer of validation when they intersect with Fibonacci levels. These lines, drawn by connecting significant swing highs or lows, highlight areas where institutional traders and algorithms might place orders. To ensure accuracy, make sure your trendlines connect at least three touchpoints, capturing the broader market structure.
Take, for instance, a scenario where Singapore Airlines is in a downtrend. If you draw a trendline connecting recent swing highs and it intersects with the 38.2% Fibonacci retracement level at S$6.28, this intersection creates a confluence zone. At this level, selling pressure could resume, suggesting that both trend-followers and Fibonacci traders are monitoring the same price point.
The strength of confluence zones can vary depending on the timeframe and market conditions. However, areas around the 61.8% Fibonacci level often yield the strongest reactions, especially when combined with a 200-period moving average or a well-established trendline.
Check for Candlestick Patterns Near Fibonacci Levels
Adding candlestick patterns to your analysis provides further confirmation and insight into market sentiment at Fibonacci levels.
Certain candlestick patterns, like Doji, Hammer, Shooting Star, and Engulfing formations, are particularly effective at signalling reversals. Each pattern reflects underlying market psychology and the likelihood of a reversal.
- Doji patterns, characterised by small bodies and nearly equal open and close prices, are especially meaningful when they appear at a Fibonacci level. For instance, a Doji at the 61.8% retracement level could indicate weakening pullback momentum and an impending reversal.
- Hammer and Shooting Star patterns are also useful. A Hammer at the 50% retracement level during an uptrend signals strong buying interest, while a Shooting Star at the same level in a downtrend points to selling pressure. The long wicks on these patterns reveal that one side of the market was tested but ultimately failed to dominate.
- Engulfing patterns tend to offer strong reversal signals. A Bullish Engulfing pattern at the 61.8% retracement level in an uptrend suggests that buyers have taken control, potentially driving prices higher. Conversely, a Bearish Engulfing pattern in a downtrend signals that sellers are regaining the upper hand.
Timing also plays a critical role. Candlestick patterns that form during high-volume periods – such as between 9:00 AM and 11:00 AM SGT or 2:00 PM and 4:00 PM SGT – are generally more reliable than those appearing during quieter trading hours.
When multiple factors align – like a Fibonacci level, a moving average, and a candlestick pattern – the chances of a successful reversal increase dramatically. Many experts recommend looking for at least two forms of confirmation before entering a trade. Additionally, always backtest your strategies and practise sound risk management, as no confluence setup guarantees success.
| Indicator Combination | Strength of Signal | Typical Use Case |
|---|---|---|
| Fibonacci + Moving Average | High | Trend confirmation |
| Fibonacci + Trendline | High | Breakout setups |
| Fibonacci + Candlestick | Medium-High | Entry timing |
| Fibonacci + Oscillator | High | Momentum shifts |
| Fibonacci Alone | Medium | Support/resistance |
Many trading platforms and resources now teach confluence-based strategies as a fundamental part of systematic trading education. For example, Collin Seow Trading Academy focuses on systematic methods and highlights the importance of combining multiple signals for improved accuracy, tailoring its guidance specifically for Singapore market conditions.
Lastly, ensure your charting platform is set to display prices in SGD (S$) and uses Singapore’s local time (SGT, GMT+8) for precise intraday analysis. This small adjustment can make a big difference in your trading accuracy.
Master Systematic Trading with Collin Seow
Learn proven trading strategies, improve your market timing, and achieve financial success with our expert-led courses and resources.
sbb-itb-466c9b0
Step 4: Wait for Confirmation Signals
Patience is a critical part of successfully identifying Fibonacci reversals. While the earlier steps help you identify potential setups, it’s essential to wait for confirmation signals before taking action. Jumping in too early can lead to costly errors, as not every price movement at a Fibonacci level indicates a genuine reversal. Confirmation signals act as your safety net, helping you separate meaningful reversals from short-term noise. By incorporating these signals, you can improve your entry precision and refine your risk management strategy.
Use Oscillators or Volume Indicators
Oscillators and volume indicators are invaluable tools for spotting momentum shifts, which can confirm reversals at Fibonacci levels.
For example, if the price approaches the 61.8% Fibonacci retracement level and the Relative Strength Index (RSI) enters oversold territory, it could indicate a strong buying opportunity. Similarly, a bullish crossover in the Moving Average Convergence Divergence (MACD) at a Fibonacci support level signals growing buying momentum. On the flip side, a bearish MACD crossover at a resistance level might suggest renewed selling pressure.
Volume indicators add another layer of validation. Imagine the price nearing the 50% retracement level while trading volume spikes significantly above its average. This would suggest strong market conviction, reinforcing the idea that the price level is respected and indicating a likely reversal rather than a temporary pause.
When tools like RSI, MACD, and volume surges align at critical Fibonacci levels, they provide multiple independent confirmations, offering a stronger case for a potential reversal.
Rely on Candlestick Confirmations
Candlestick patterns provide clear visual signals of market sentiment shifts at Fibonacci levels, complementing the insights from oscillators and volume indicators.
Certain candlestick patterns are particularly reliable for confirming reversals. For instance, a Hammer forming near the 61.8% retracement level suggests that buyers have stepped in after a sell-off, reinforcing the support at that level. A Doji pattern, on the other hand, signals market indecision, which could mean the previous trend is losing steam.
Engulfing patterns are especially powerful. A Bullish Engulfing pattern near a key Fibonacci level shows that buyers have overtaken sellers, strongly validating the likelihood of a reversal. However, it’s crucial to wait for the candlestick pattern to fully form to avoid acting on false signals.
Expert traders from Collin Seow Trading Academy stress the importance of combining multiple signals before making trading decisions. Their programmes advocate for disciplined execution, teaching traders to wait for at least two independent confirmations – such as a candlestick pattern and an oscillator – before entering a position.
Once you’ve confirmed the reversal, you’ll be ready to set your stop-loss and take-profit levels in the next step.
Step 5: Set Stop-Loss and Take-Profit Levels
Once you’ve confirmed reversal signals in Step 4, the next critical move is to manage your risk effectively. This involves setting clear stop-loss and take-profit levels. Using Fibonacci levels can help you establish disciplined exit points, keeping your risk under control while positioning yourself for potential profits.
Placing Your Stop-Loss Beyond the Next Fibonacci Level
After identifying a reversal signal, the first step is to protect your trade by setting a stop-loss. Place it just beyond the next Fibonacci level. This approach minimises risk while avoiding unnecessary triggers caused by minor price fluctuations or market noise.
Example: Let’s say the STI retraces to S$3,250 after a rally between S$3,200 and S$3,300. You decide to enter at S$3,250. In this case, set your stop-loss at S$3,235, just below the 61.8% retracement level. This strategy limits your risk to 15 points.
It’s important to adjust the buffer for your stop-loss based on the asset’s volatility. Setting it too close to the Fibonacci level can lead to premature exits, especially in volatile markets.
Using Fibonacci Extension Levels for Profit Targets
Fibonacci extension levels are a powerful tool for identifying potential price targets beyond the initial move. Commonly used levels include 100%, 161.8%, and 261.8%, each offering a logical point to lock in profits.
For instance, continuing with the STI example, if you enter at S$3,250 and the reversal holds, you might aim for the 161.8% extension level, which projects to about S$3,365. This setup offers a potential profit of S$115 per contract while maintaining a risk of just S$15.
To refine your profit targets, combine Fibonacci extension levels with other indicators like previous resistance zones or round numbers. Many traders adopt a scaling approach, taking partial profits at the 100% extension (around S$3,300 in this case) and letting the remaining position run to the 161.8% level.
Your choice of extension level should align with market conditions and your risk tolerance. In strong trending markets, the 261.8% level might be achievable, while in more unpredictable conditions, the 100% or 161.8% levels are often more realistic. A 2021 study highlighted that pairing Fibonacci retracement levels with other indicators can improve the accuracy of entry and exit points.
Trailing Stop-Loss Orders to Secure Profits
As the trade moves in your favour, consider using trailing stop-loss orders to lock in profits. Adjust your stop-loss dynamically, moving it just beyond the next Fibonacci level or a recent swing low/high. This allows your trade to develop further while safeguarding gains.
“Experts often recommend trailing stop-loss orders to lock in profits as price moves in the trader’s favour”, according to Collin Seow Trading Academy. They advocate for systematic risk management strategies, including dynamic adjustments of stops and targets based on price action.
Lastly, ensure your position size reflects both the stop-loss distance and your overall account risk tolerance. For wider stop-losses due to higher volatility, reduce your position size to keep your risk per trade consistent.
Conclusion: Mastering Intraday Reversals with Fibonacci
Recap of the 5 Steps
Spotting intraday reversals using Fibonacci involves a structured approach that blends technical analysis with disciplined execution. These five steps provide a clear framework for identifying high-probability setups.
Start by pinpointing the primary trend on higher timeframes. This step ensures you’re trading in alignment with the market’s overall direction, avoiding unnecessary risks. Next, draw Fibonacci retracement levels from the correct swing points. These levels help you identify zones where the price may pause, reverse, or continue its movement.
The third step is about finding confluence. Look for other indicators, like moving averages or candlestick patterns, that align with Fibonacci levels. This additional layer strengthens the validity of your setup. Fourth, wait for confirmation signals from tools like oscillators or volume indicators to avoid jumping into trades too early.
Lastly, commit to strict risk management. These steps together create a reliable method for identifying potential reversals, giving you a solid foundation to apply in live trading.
Final Trading Tips for Success
To sharpen your trading skills, start by practising on a demo account denominated in SGD. This allows you to experience real market conditions without risking actual money. Use this time to refine your strategy and build confidence.
Discipline is non-negotiable. Your technical setups are important, but your mindset and emotional control play an equally critical role. Keep a trading journal, noting each session’s details in DD/MM/YYYY and 24-hour time formats. Reviewing your trades regularly helps you internalise your approach and improve consistency.
Consider structured learning opportunities to deepen your understanding. For example, Collin Seow Trading Academy offers trading courses, free webinars, and resources that focus on systematic strategies. Their emphasis on combining technical analysis with risk management aligns seamlessly with Fibonacci-based techniques.
FAQs
What are the steps to use Fibonacci retracement levels for spotting intraday reversals?
Fibonacci retracement levels are a handy tool for spotting potential intraday reversal points. Here’s how you can make the most of them:
- Spot the trend: Begin by identifying whether the market is in an uptrend or downtrend within your selected timeframe.
- Plot the levels: Use the Fibonacci retracement tool to map levels between a key high and low on the chart.
- Find overlaps: Look for areas where Fibonacci levels align with existing support or resistance zones – this overlap can indicate stronger reversal points.
- Observe price behaviour: Keep an eye on how the price reacts around these levels. Patterns like candlestick formations can signal potential reversals.
- Use alerts and plan your risk: Set alerts for key levels and always have a stop-loss strategy in place to safeguard your trades.
If you’re keen to sharpen your trading skills, check out the resources and courses offered by Collin Seow Trading Academy. They’re designed to guide traders towards more consistent and confident decision-making.
What are common mistakes traders make with Fibonacci tools, and how can they be avoided?
Many traders use Fibonacci tools, but mistakes can creep in that might derail their trades. Let’s look at some common errors and how to steer clear of them:
- Relying solely on Fibonacci levels: Fibonacci retracement and extension levels can highlight potential price reversals, but they’re not foolproof. Always pair them with other indicators or price action to confirm your analysis.
- Ignoring the bigger picture: Applying Fibonacci tools without considering the overall market trend or key support and resistance levels can lead to missed signals. Start by understanding the broader market structure before diving into Fibonacci levels.
- Cluttering your analysis: Overloading your charts with too many Fibonacci levels or combining them with an array of indicators can lead to confusion. Focus on the main levels – 38.2%, 50%, and 61.8% – and keep your charts simple and easy to read.
By staying disciplined and following a clear trading plan, you can avoid these common pitfalls. If you’re looking to sharpen your skills, consider exploring resources that focus on structured trading strategies.
Why should Fibonacci levels be combined with other indicators, and which ones work best for confluence?
Combining Fibonacci levels with other tools is a smart way to strengthen your trading strategy. While Fibonacci tools can highlight potential reversal or extension points, using them alone might lead to false signals. Adding other indicators into the mix provides extra confirmation, making your decisions more reliable.
For example, moving averages are great for spotting trends, helping you understand the broader market direction. Meanwhile, the RSI (Relative Strength Index) can signal when an asset is overbought or oversold, giving you clues about possible reversals. On top of that, candlestick patterns can act as an extra layer of confirmation, especially at key Fibonacci levels. By combining these tools, you’ll be better equipped to pinpoint intraday reversal points with more confidence.