Best Technical Indicators To Combine
New traders have a lot to grapple with because the learning curve for trading is very steep. A trader needs to be proficient at various aspects of trading in order to become consistently profitable. One of the areas which traders can look to become proficient in quickly, is in terms of trading strategy.
A strategy is derived from the trader’s beliefs in the market and then distilled into a methodology to trade this belief. Since new traders don’t know what to believe in the markets, they can emulate what other successful traders are doing.
Successful traders already have firm beliefs in the markets and strategies which are working well for them. You can then combine technical indicators to illustrate these beliefs to form a simple trading system.
But of course if you don’t share your beliefs, or you can’t find a successful trader to emulate, new traders will take the longer route and try to discover a strategy for themselves.
The difficult thing is not so much about finding a great strategy, but actually sticking to a good strategy with good risk management. The secret to doing this, is first to discover your beliefs in the market, build a strategy around it, and then most importantly, stick with the strategy with good risk management even through periods of draw down. So now that we’ve highlighted the key points to note, let’s take a look at some simple ideas.
As you can imagine, there are a lot of things to do in this area of trading alone. This article only addresses the task of forming a simple trading system based on your beliefs in the market.
Trend And Mean-Reversion
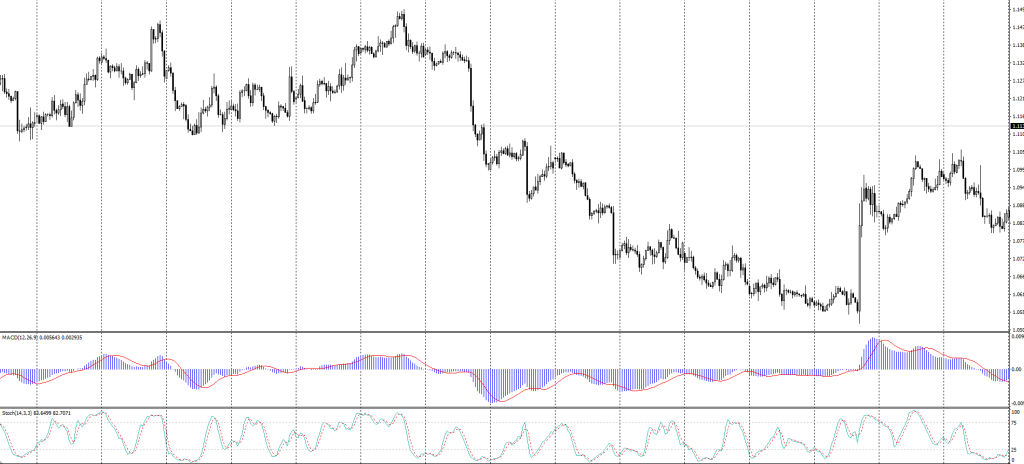
Combine MACD And A Stochastic
There are many different beliefs in the market, so I’ll just work on the 2 simplest ones. Trend and mean-reversion. There are other characteristics of the market but they will intersect in some way with these 2 broad categories.
For a trend system, you need something to indicate the strength and direction of trend. Usually Moving Averages or MACD will do a good job. But when it comes to timing your entries, they will usually get you in late. So to compensate for the delay, you can use an oscillator.
So for instance, you could be using the MACD and a stochastic together. You find the trend with the MACD, then you can use the stochastics oscillator to time your entry. If the MACD indicates an uptrend, you can look for the stochastics coming up from oversold conditions to enter the market.
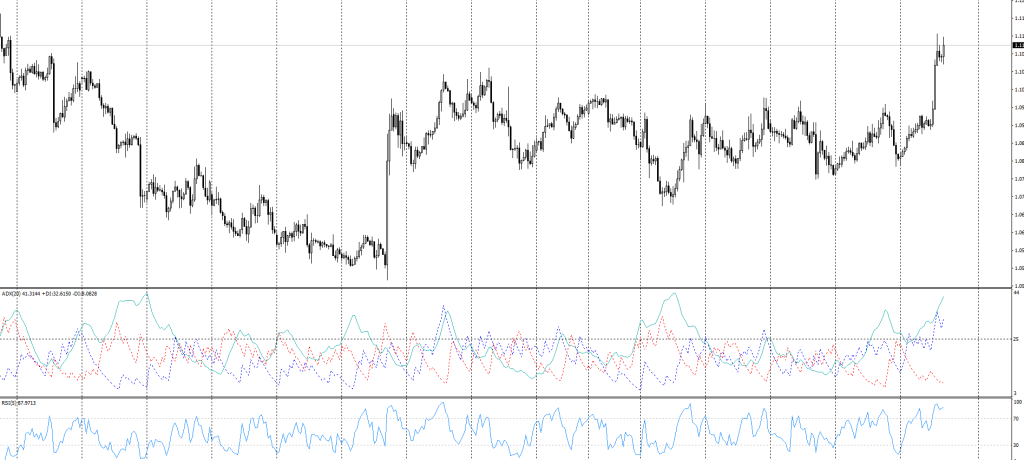
Combine ADX And RSI
For a mean reversion strategy, you can consider a combination of ADX and RSI. This time you take signals from the RSI only when the ADX has a low reading to indicate no strong trend in the market.
Do take note that the ADX has no directional bias, it merely tells you the strength of the trend at that point. So it’s up to you to decipher the market trend, which should not be difficult when the ADX shows a strong trend reading.
When ADX shows a low trend reading, you don’t need to note the trend direction as you’re likely in a range bound environment, which is good for mean reversion strategies.
There are many indicators out there to indicate trend strength, and possibly even more oscillators.
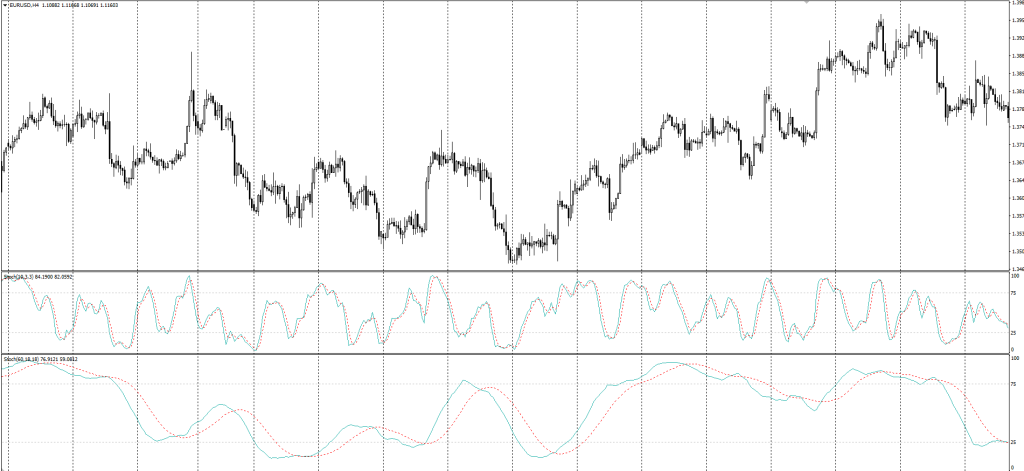
You might even consider using the oscillator on a higher time frame to indicate trend, and then the oscillator on a lower time frame to get your entries.
For example the 10 period stochastic on the daily chart for trend, this means the stochastic should have recently recovered from overbought or oversold, and is traveling towards the other end of the band. Then you could use a 10 period stochastic on the H4 charts to time your entry. There are many ways to cook an egg, so do more backtesting, make objective observations and come up with clear and simple rules.
Hint #1: You could add the 60 period stochastic to the H4 chart to get the Day chart’s 10 period stochastic, because 4 hours x 6 gives you 1 day’s period.
Hint #2: You will observe special situations, such as extended overbought or oversold conditions on the oscillators, make simple rules to handle these, but not too many otherwise you run the risk of “curve-fitting” your rules.
Of course, using an indicator system has to be complemented with knowledge of interpreting price action from the chart. It is highly unlikely that you can succeed as a trader just by blindly following the signals from indicators. A broader context will serve you well to increase your bottom line as well.