About the Security (NASDAQ: AAXJ)
iShares MSCI All Country Asia ex-Japan ETF seeks to track the investment results of an index composed of Asian equities, excluding Japan. The ETFs exposure comprises of large to mid-sized companies in emerging and developed Asian economies (excluding Japan).
Security background:
Asian equities have underperformed rest of the world equities since more than a decade, largely on account of the deleveraging and deflationary cycle in China (China accounts for more than a third of AAXJ, followed by Taiwan, India, and South Korea). However, the tide could be beginning to change on a mix of factors:
- Policy reforms and stimulus in China could unwind some of the deflationary pressures and boost consumption.
- The recent US debt rating downgrade by Moody’s has accelerated the reassessment of the US ‘exceptionalism’ theme which involves high growth rate and global reserve currency status, including safe-haven US Treasuries.
- Mounting US debt, tariffs, weaker US dollar could lead to a shift of flows into under-owned Asian equities.
- From a valuation perspective, Asia ex-Japan, led by China, is trading attractively relative to some of its peers, especially US equities.
AAXJ (Daily):
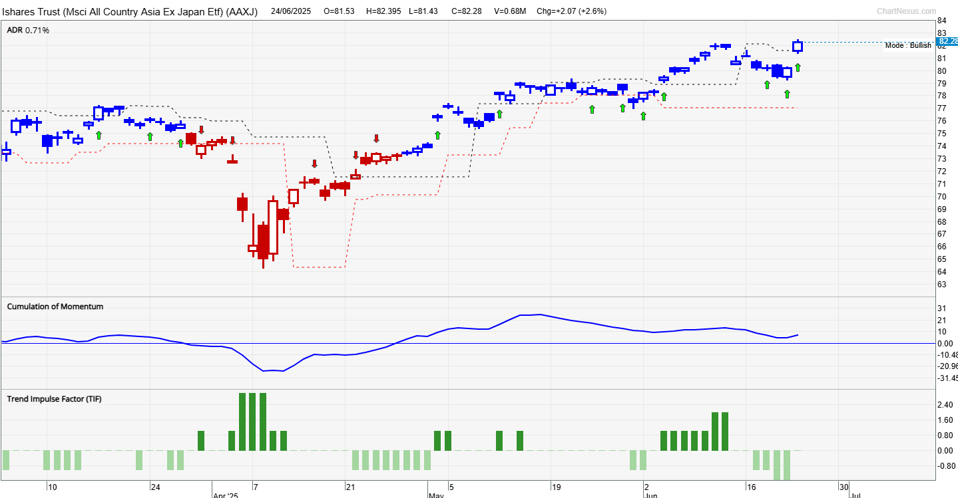
Technical Analysis on MSCI All Country Asia ex-Japan (NASDAQ: AAXJ)
Our proprietary system TradersGPS (TGPS) has turned Bullish on AAXJ from a near-term and from a multi-month perspective (the daily and the weekly charts are both Bullish). For instance, the colour of the candles turned Blue at the end of April, indicating the stock was in an uptrend. As per our system, Blue candles indicate the stock’s trend is up. Red candles indicate the trend is down.
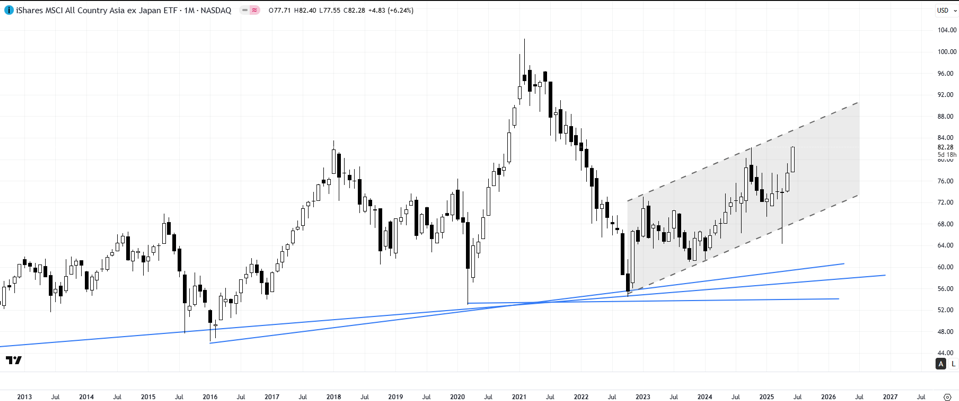
On the monthly candlestick charts, following the sharp 2021-2022 fall, the ETF has consolidated in a slightly upward-sloping channel. The rebound this year from the lower edge of the channel, coupled with renewed upward momentum (big white body candles) is a sign that the tide could finally be turning in favour of Asian equities. Immediate resistance is at the October high of 82.25. A break above could pave the way toward 84.15 (the 78.6% retracement of the 2021-2022 slide), with subsequent resistance at the 2021 record high of 102.45.
The risk is that the ETF falls below converged support on the lower edge of the rising channel, roughly coinciding with the April low of 73.80. Such a fall could expose downside risks toward the 2022 low of 54.40.