Volatility And Volume In Stock Market
Entering into 2022, I wondered if the Santa Claus Rally would continue on for a couple more days…
Alas, the market is certainly unpredictable.
After some days of pulling back, it seems to be grinding back up once again. Noting that the overall trend maintains and already having an exit plan in place certainly helps.
By that, I also mean that my emotions do not ride and up down in accordance with the market’s price actions.
On that note, I certainly think that the volatility is here to stay. This is related to one of the topics that we will be exploring in this article on volatility indicators. Thereafter, we’ll talk a little about volume indicators as well.
These indicators are relatively less utilized by novice traders. This is in contrast to the earlier trend indicators and momentum indicators that we looked at in the previous part here.
I would say part of the reason would be that the application of trend and momentum indicators would already allow you to see results. Plus, they are easy to understand and simple to use.
Nonetheless, it helps to know what other indicators might be suitable for your trading style. You could also use these other indicators to increase your odds of a successful trade.
So let’s dive right into volatility indicators first.

Types Of Indicators #1: Volatility Indicators
Volatility indicators measure how far the price stretches away from its mean price. In terms of the direction, this can either be higher or lower.
With volatility indicators, one can gain an understanding about the range of buying and selling. During periods of low volatility, price movement is quiet and short-term swing trades tend to be more predictable.
Similarly, during periods of high volatility, price movement is noisy and dramatic and short-term swing trades become highly unpredictable.
When there is high volatility, this also reflects the market sentiment that there are greater extremes in greed and fear.
While there is more that can be said about volatility indicators, let’s take a look at two indicators and how to utilize these when it comes to actual trading.
Bollinger Bands
The Bollinger Bands is probably the most well-known volatility indicator. It is represented by three lines: the simple moving average serves as the middle band, and the equally-distanced upper and lower bands are constructed by means of standard deviation.
These bands expand and contract in reaction to the changing levels of volatility.
For a deeper understanding on the history, calculations and rationale on the Bollinger Bands, feel free to head over to the official website.
What we are interested in, as usual, is how to apply this in trading.
One way is to first identify a “squeeze” of the bands, where the distance between the upper and lower bands gets smaller and closer to each other. This forms the set-up.
When the price moves – either up or down – that direction is the impulsive move and triggers a trade in that direction.
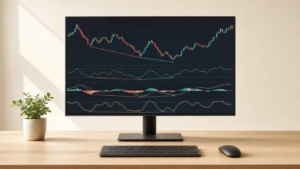
Take the example of Apple’s 1-year chart. Can you see the latest “squeeze” around mid-November?

After the squeeze, we see the impulsive move upwards from $154.3, which would trigger a bullish trade.
Keltner Channel
Similar to the Bollinger Bands, the Keltner Channel is also represented by three lines. The middle band takes the exponential moving average (as opposed to the simple moving average). The equally-distanced upper and lower bands are then calculated as a multiple of the average true range (as opposed to standard deviation).
While the bands also expand and contract, the Keltner Channel is less reactive as compared to the Bollinger Bands – see how both indicators react relative to the price action:

For more reading into the Keltner Channel, check out this Investopedia article.
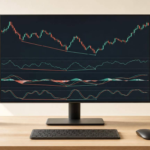
In terms of utilizing the Keltner Channel, the angle of the channel helps to identify the direction of the trend – sloping upwards to denote uptrend, downwards for a downtrend, and horizontal for a sideways trend.
Besides that, it also shows the strength of the price. If price is in the upper band and in an upwards trend, and possibly piercing through the band, it shows strength in the price. The reverse also holds true for price in the lower band in a downward trend.
So, the Keltner Channel can be used to help identify entry opportunities. If price pulls back to the middle line in an uptrend, traders could use this as an entry opportunity for a swing trade. If price rallies to the middle band in a downward trend, it could similarly be an entry opportunity for a swing short trade.
Looking at the chart of Apple once again, this time without the Bollinger Bands on the same chart… How many entry opportunities can you identify? Would these have been profitable trades?

Types Of Indicators #2: Volume Indicators
Before we get all excited about the application of volatility indicators, let’s go through another simple but powerful technical tool – volume indicators.
As the name suggests, volume indicators indicate how many stocks were bought and sold.
This helps to gauge how other traders perceive the market, and is used for confirmation of trends and patterns.
The strongest trends, therefore, often occur with increase in volume. It could also be the case that when traders see an increase in volume which confirms the trend, it further acts as a catalyst for more price action.
This also means that if there are large price actions without the accompanying high volume, this shows less strength and may be a sign of an upcoming reversal.
Let’s take practical examples below with the On-Balance Volume (OBV) and Chaikin Money Flow (CMF) on how volume indicators work.
On-Balance Volume (OBV)
The OBV is a cumulative indicator which calculates buying and selling pressure by (1) adding to the volume on up days, and (2) subtracting from the volume on down days.
If a stock closes higher than the previous day, that day’s volume would be considered as an up volume. The reverse also holds true for closing lower, which would make it a down day.
As mentioned above, volume indicators are used to confirm trends.
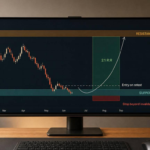
Going back to our example of Apple – the upward trend from November was confirmed by the OBV’s formation of higher highs:

As the price continued to move higher, however, the OBV’s subsequent peaks in December became lower than the peak at the end of November. This signals a negative divergence, and the upward trend is likely to pullback.
For now, it does seem that Apple is trending sideways in the short-term from December.
Besides the OBV, let’s also see how the Chaikin Money Flow performs as a volume indicator.
Chaikin Money Flow (CMF)
The CMF monitors the flow of money in and out of the market. Unlike the OBV, the CMF is an oscillator as it fluctuates above/below the zero line.
A positive value above the zero line indicates strength, while a negative value below the zero line shows weakness.
In acting as a confirmation signal, the CMF should breakout in the direction of the price to confirm the trend. This means that it should be in the positive region in an uptrend, and negative region for a downtrend.
Similarly, if the price was making higher highs but without the volume to support this – as in the chart above using the OBV – this would indicate negative divergence.
Let’s take a look at the CMF to see if it picked up this divergence like the OBV did:

Although the CMF did show higher highs from the start of December, the CMF peaked at 0.2 when price was at $178.90. Thereafter, it started to form lower lows while price trended sideways.
At present, the CMF has just turned positive once again, which is a sign of strength. It remains to be seen over the coming days if price would indeed rally in accordance with the CMF.
Combining Indicators Together
In general, it is recommended to use less than 5 indicators. Focusing your efforts to learn the intricacies of a select few indicators would be more fruitful than attempting to broadly cover more indicators.
Having more indicators could be confusing with the various signals they generate. In the example of having both Bollinger Bands and Keltner Channel together, the overlapping lines can also make it difficult to read.
Therefore, take time to see how the indicators have performed over time. Get to know which generate the signals that suit your trading style.
For instance, if you prefer to get in on the action more quickly – the Bollinger Bands could be selected over the Keltner Channel, since it is more reactive.
On that note, choose indicators that complement one another. They should not generate the same signals. Rather than using both the OBV and CMF together, choose one volume indicator to complement other trend / momentum / volatility indicators.
Conclusion: Types Of Volatility Volume Indicator
Having clarity and conviction in your trades is important. To that end, these technical indicators should serve to reinforce your trading success.
Instead of confusion, select the indicators which you understand, suit your trading style, and of generate reap profits for you.
On that note, there is no 100% combination which works. And oftentimes, it pays to be patient and wait for the set-up for a higher success rate.
In trading, be prepared to take some losses. Having an exit plan does not simply refer to profit targets. It also means having the discipline to cut losses when the trade goes against you.
When in doubt, do not hesitate to paper trade first.
As the saying goes – the bulls take the stairs and the bears jump out of the window (or in some other versions, they ride the elevator).
To stay in the game for the long run, you would need to keep growing your capital.
While it is easier said than done, practice and time in the markets help, as does growing and applying your knowledge.
Can anybody start trading and investing on their own? If you’ve read up to this point, the answer is a resounding yes. Stay tuned to the next parts of the series as we adopt a systematic approach in generating a step-by-step beginner’s guide.
If you’d like to learn more about systematic trading to better time your trade entries, click the banner below: