Validating trading signals ensures you’re not relying on guesswork or flawed strategies. Without proper validation, you risk acting on “false positives” that lead to losses. Here’s how you can use key metrics to evaluate your trading signals effectively:
- Win Rate & Profit Factor: A high win rate doesn’t guarantee profitability. Combine it with a profit factor (aim for at least 1.5) to assess if your wins outweigh losses.
- Accuracy, Precision & Recall: Go beyond win rates. Measure how often your signals are correct (accuracy), profitable (precision), and how well they capture opportunities (recall).
- Risk Metrics: Use the Sharpe ratio (risk-adjusted returns) and maximum drawdown (biggest account dip) to understand your strategy’s risk profile. Avoid strategies with drawdowns above 25%.
- Real-Market Testing: Backtests are theoretical. Forward-testing in live conditions helps uncover real-world issues like slippage and execution delays.
- Validation Table: Compare backtest and forward-test metrics side-by-side to detect inconsistencies or overfitting.
sbb-itb-466c9b0
Key Metrics for Validating Trading Signals
Once you understand why validation is crucial, the next step is figuring out which metrics can confirm if your trading signals are dependable. These metrics transform backtesting data into actionable insights, helping you separate strong strategies from those that merely perform well on historical data.
Some of the key metrics include win rate and profit factor, precision and recall, and risk-adjusted performance indicators. Each one focuses on a unique aspect of performance, such as profitability, consistency, or risk management. Together, they offer a comprehensive view of whether a trading signal is worth your investment. Think of these as essential tools for bridging theory and practice in signal validation.
Win Rate and Profit Factor
Win rate is one of the simplest metrics to calculate: divide the number of winning trades by the total number of trades, then multiply by 100. For example, if you made 50 trades and 30 were profitable, your win rate would be 60%. While straightforward, this metric can be misleading. A high win rate, like 70%, might seem impressive – but if your losses are significantly larger than your wins, you could still end up in the red.
This is where the profit factor comes in. It’s calculated by dividing your gross profit by your gross loss. For instance, a profit factor of 1.5 means you earn S$1.50 for every S$1.00 you lose. Most professionals consider this the bare minimum after factoring in costs like commissions and slippage. Institutional traders often aim for a profit factor of at least 1.75 as a baseline for a viable strategy.
The interplay between win rate and profit factor is crucial. Trend-following strategies, for example, often have low win rates (around 40%) but compensate with high profit factors. On the other hand, mean reversion strategies typically aim for win rates above 70% but accept lower profit factors. Understanding this balance can help you set realistic expectations for your trading approach.
Signal Accuracy, Precision, and Recall
Looking beyond the win rate, three additional metrics can assess how reliable your signals are: accuracy, precision, and recall.
- Accuracy measures the overall correctness of your predictions, showing the percentage of trades that align with your forecasts.
- Precision focuses on how many of your “buy” or “sell” signals actually resulted in profitable trades. It’s calculated as the ratio of true positives to all predicted positives.
- Recall evaluates how well your strategy captures opportunities in the market, calculated as the ratio of true positives to actual positives.
These metrics are especially important in markets where profitable setups are rare. For instance, a strategy with a 65% win rate but only 20 trades may have a p-value above 0.2, suggesting there’s a 20% chance the results occurred by luck. High precision helps minimise unnecessary trades and costs, while high recall ensures you don’t miss major market moves.
“A low win rate increases the chances of behavioural mistakes, high drawdowns, and ruin.” – Oddmund Groette
When these metrics are examined together, they provide a clearer picture of a strategy’s reliability. A larger sample size and consistent precision across different market conditions are strong indicators of genuine performance rather than coincidental success.
Sharpe Ratio and Maximum Drawdown
Validating signals also involves understanding their risk profile, which makes tools like the Sharpe ratio and drawdown analysis indispensable.
The Sharpe ratio measures risk-adjusted returns. Its formula is: (Average Return – Risk-Free Rate) ÷ Standard Deviation of Returns. This metric tells you whether your returns justify the volatility you endure. A Sharpe ratio between 1.0 and 2.0 is generally considered acceptable for professional strategies, while anything above 3.0 might indicate overfitting.
Maximum drawdown, on the other hand, measures the largest percentage drop in your account from a peak to a trough before it recovers. For example, if your account peaked at S$100,000 and later dropped to S$75,000, your maximum drawdown would be 25%. This metric reveals your worst-case scenario and the psychological stress you might face.
Recovering from drawdowns can be tough: a 50% drawdown requires a 100% gain to break even, while a 75% drawdown demands a staggering 300% recovery. Because of this, professional traders often avoid strategies with drawdowns exceeding 25%. Additionally, live trading typically involves larger drawdowns – 1.5 to 2 times greater than those seen in backtests – due to factors like slippage and changing market conditions. Building a buffer into your risk limits is a smart move.
Real-Market Metrics for Signal Validation
Backtesting might show your strategy as a winner, but live trading is the real test. The truth is, more than 70% of strategies that perform well in backtests fail under live conditions. Why? Because backtests often assume perfect execution – something that rarely happens when real-world factors like slippage and delays come into play.
Real-market metrics give you a clear picture of how your strategy holds up when it’s actually trading. Unlike backtests that rely on idealised assumptions, these metrics account for the inevitable frictions of live trading, such as spreads, slippage, and latency. Without this validation step, you could end up with a strategy that looks profitable on paper but loses money in practice.
Slippage and Arrival Price
Slippage is the gap between the price you expect and the price you actually get. Ignoring it can inflate your strategy’s profitability by as much as 30%. Factors like market volatility, order type, and execution speed all contribute to slippage.
To measure slippage effectively, you start with the arrival price – the mid-price or liquidity available the moment your signal fires. Comparing the arrival price to your actual execution price reveals how much latency and market impact cost you. For strategies like high-frequency trading, you’ll need Level 3 data, which tracks every change in the order book, to accurately simulate queue positions and fill rates.
Dynamic slippage modelling goes even deeper. Instead of assuming a flat cost like “1 tick per trade”, it calculates the actual liquidity available in the order book at the time of execution. This is particularly important in volatile markets where spreads widen and liquidity thins out. Simulating a small latency, like 50 milliseconds between signal generation and order arrival, can also give you a better sense of real-world conditions.
One practical tool is the slippage tolerance curve. By gradually increasing slippage during testing, you can identify the point where your strategy’s edge disappears. If your strategy can’t handle slippage that’s 50–100% higher than current averages, it’s likely too fragile for live trading. For highly liquid markets, you might add a buffer of 1 tick, while for less liquid ones, 2–3 ticks is more appropriate.
Finally, compare your execution prices against benchmarks like TWAP (Time Weighted Average Price) and VWAP (Volume Weighted Average Price). If your execution consistently underperforms these benchmarks, it’s a red flag – your strategy might need adjustment, or your broker’s execution quality might not be up to par.
Forward-Testing Results
Forward-testing is where theory meets reality. This step involves testing your strategy in actual market conditions, either through a demo account or a small live account, to capture real-world factors like spreads, slippage, and execution delays.
To ensure meaningful results, stick to clearly defined rules for entries, exits, and systematic trading risk management. For example, set parameters like stop-loss levels, profit targets, and trading hours (e.g., London or New York sessions). Also, establish risk limits, such as risking 1–2% per trade or setting a daily loss cap.
The key to success here is meticulous logging. Keep track of every trade, noting slippage, spreads, and delays. A good practice is to run a 30-day “shadow phase”, where you execute trades in a simulated account in real-time. This helps you measure how often your strategy executes as planned – its “participation rate”.
“No matter how good your backtest is, the first contact with the real market always reveals differences.” – Ernest Chan, Author of Algorithmic Trading
Analyse your forward-testing results with a meaningful sample size – typically 50–100 trades. Metrics like expectancy, profit factor, and maximum drawdown will give you a clear picture of your strategy’s performance. If your forward-testing results align closely with your backtest, your strategy is likely robust. If not, you may have uncovered issues like overfitting, look-ahead bias, or unrealistic execution assumptions.
Building a Validation Summary Table
Once you’ve gathered insights from backtesting and forward testing, the next step is to organise these results into a single table. This validation summary table provides a clear, side-by-side comparison of key metrics, helping you assess whether your strategy can perform reliably in actual market conditions.
To set up your table, divide the data into two columns: In-Sample (IS) and Out-of-Sample (OOS). The IS column reflects backtest results, typically derived from 70–80% of historical data used for optimisation. Meanwhile, the OOS column represents forward-test or live trading results, based on the remaining 20–30% of data. This division is essential to avoid overfitting, or as Ronald Coase aptly said:
“If you torture the data long enough, it will confess to anything”.
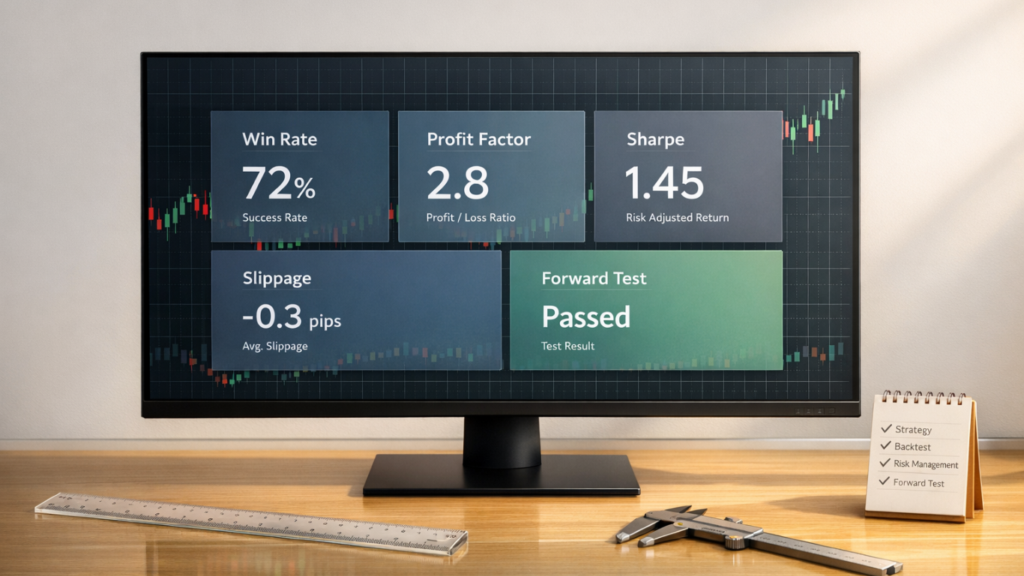
Your table should include metrics like Win Rate, Profit Factor, Sharpe Ratio, Maximum Drawdown, Average Slippage, and the Walk Forward Ratio. For instance:
- A Win Rate of 65% in backtesting is acceptable if the forward-test stays within a 10–15% deviation.
- A Profit Factor above 1.5 in backtesting should not fall below 1.2 in live trading.
- The Walk Forward Ratio (OOS return divided by IS return) should ideally exceed 0.5 to indicate robustness. Anything below 0.3 suggests the strategy may lack durability.
Here’s an example of how your summary table might look:
| Metric | Backtest (In-Sample) | Forward-Test (Out-of-Sample) | Status/Warning |
|---|---|---|---|
| Win Rate | 65% | 58% | Acceptable if deviation is within 10–15% |
| Profit Factor | 1.8 | 1.4 | Robust if above 1.2; caution if near threshold |
| Sharpe Ratio | 1.5 | 1.1 | Acceptable if above 1.0 for day trading |
| Max Drawdown | 12% | 15% | Monitor – exceeding 1.5 times the backtest figure |
| Avg Slippage (Ticks) | 1.0 | 2.0 | Expected higher in live trading |
| Walk Forward Ratio | N/A | 0.65 | Robust if above 0.5 |
Pay close attention to deviations in these metrics. For example, if live trading shows a maximum drawdown exceeding 1.5 times the backtest figure, it’s time to reassess your risk settings. Similarly, if doubling your slippage estimate renders the strategy unprofitable, it may not be robust enough for live markets. As Kevin Davey, a World Cup Trading Champion, puts it:
“Only 1 out of every 20 strategy ideas survives a complete validation process to reach live trading”.
This table not only summarises your results but also highlights areas needing adjustment, such as risk management or execution tactics. It helps you identify strategies ready to handle real-world trading challenges versus those that might crumble under pressure.
How to Apply Metrics in Systematic Trading
Applying Validated Metrics
After creating your validation summary table, the next step is to apply those metrics to your trading decisions. Systematic trading relies on fixed rules to eliminate emotional bias. Start by conducting multi-timeframe analysis, such as using a 3:1 or 4:1 ratio, to confirm trends. For instance, you can use a daily chart to identify the primary trend, a 4-hour chart to spot setups, and a 15-minute chart to fine-tune your entry points. Keep an eye on whether your refined signals stay within the thresholds established during validation. If forward-testing shows a noticeable drop in performance compared to backtesting, you might need to tighten your filters or adjust your risk parameters.
Incorporate risk management into your signal refinement process. Position sizing can follow fixed formulas, such as limiting trade risk to 1–2% of your capital. Use validated volatility metrics like the Average True Range (ATR) to set stop-loss levels. Additionally, track Maximum Adverse Excursion (MAE) to evaluate how effective your stop-loss levels are. Think of your trading plan as a “living document” – review entry and exit rules weekly and reassess risk parameters and position sizing monthly. Discipline is critical; even top traders with win rates of 40–60% succeed by sticking to their validated rules.
To deepen your understanding, consider leveraging structured educational resources.
Use Educational Resources
If you’re looking to sharpen your systematic trading skills, the Collin Seow Trading Academy offers a range of resources designed to help traders refine their techniques. One standout programme is the Systematic Trader Program (SMT®), which has trained over 6,500 students. This course provides a framework for profitable, rule-based trading. It features the TradersGPS proprietary algorithm, which generates clear buy and sell signals based on validated metrics, helping traders execute strategies without emotional interference. Success stories include a student achieving an 80% hit rate within two weeks on the Hong Kong Stock Exchange and another who earned a return of over 100% within eight months by applying systematic trend trading methods taught in the programme.
For beginners, the Market Timing 101 free e-course introduces a simple strategy for precise buy and sell timing. Meanwhile, the Systematic Trading Profits live webclass focuses on a 3-phase growth system to master stock trading. Additionally, the book The Systematic Trader v.2 offers a detailed methodology for refining trading plans and managing risk effectively, covering both options and cryptocurrencies. These resources underscore the importance of psychology in trading.
“In order to be a successful trader, the psychology is just as important as the system, if not more” – Sunny, Trader/Business Owner
Conclusion
Validating trading signals with metrics isn’t just about crunching numbers – it’s about laying the groundwork for a disciplined and reliable trading approach. Without this objective layer of validation, trading becomes more about luck than strategy. Metrics like win rate, profit factor, Maximum Adverse Excursion (MAE), and Maximum Favourable Excursion (MFE) act as your guide, helping you identify real opportunities while filtering out market noise. They also play a crucial role in fine-tuning your stop-loss levels, position sizing, and exit strategies. With validated metrics, you gain the confidence to stick to your plan, even when emotions threaten to take over.
By incorporating these metrics into a systematic trading approach, you shift from gambling to a methodical process. Knowing your strategy has a mathematical edge – like maintaining a profit-loss ratio of at least 2:1 – allows you to trade with conviction, even if your win rate is only 40%. This mindset shift, from chasing frequent wins to focusing on long-term profitability, is what separates successful traders from the rest. As Bryan Ang aptly states, “90% of traders lose money, not because of poor strategies, but due to a lack of discipline”.
If you’re ready to take this disciplined, metrics-driven approach to the next level, the Collin Seow Trading Academy offers resources to help you get started. From the free Market Timing 101 e-course to the comprehensive Systematic Trader Program (SMT®), you’ll gain access to frameworks that have already guided over 6,500 students. Tools like the TradersGPS proprietary algorithm provide clear buy and sell signals based on validated metrics, helping you execute trades with confidence and without emotional interference.
FAQs
How many trades are needed for reliable results?
When it comes to determining the number of trades needed for reliable results, there’s no one-size-fits-all answer. It largely depends on your specific strategy and how confident you are in its performance. That said, a larger sample size generally leads to more dependable outcomes because it helps account for natural variability. To truly assess the strength of your strategy, make sure your backtest includes a sufficient number of trades. Relying on a small sample can lead to misleading conclusions, so aim for data that’s both meaningful and statistically sound.
What’s a good profit factor if my win rate is low?
A solid profit factor for a low win rate is generally 2:1 or higher. In simple terms, this means that the average profit you make on a trade should be at least twice the size of your average loss. This balance is crucial to stay profitable and compensate for the fewer successful trades.
How do I estimate slippage realistically before going live?
To get a realistic sense of slippage, you need to account for key factors like market spreads, liquidity, and the size of your order compared to the market’s depth. One way to do this is by reviewing historical data or testing your strategy in a demo environment. This allows you to observe how prices behave under comparable conditions.
Incorporating transaction costs and standard liquidity metrics into your analysis can make your estimates more accurate. Additionally, tweaking your order sizes to align with the available market liquidity can help reduce unexpected slippage when trading live.