
Geopolitical Tensions and Oil Price Shock
Escalating tensions in the Middle East, stretched valuations, and overbought conditions point to the risk of a minor retreat in US equities.
About a month ago, we highlighted the risk of a minor retreat in the S&P 500 (“US Equities: Possibility of a Minor Correction,” dated 6 February 2026). Since then, US equities have remained sideways and haven’t pulled back noticeably.
However, US and Israel military attacks on Iran and reports of the retaliation by Iran suggest the path of least resistance for risk assets could be down for now.
Oil prices have surged on concerns of supply disruption; defence stocks have jumped while airline stocks have declined on fears of a prolonged conflict. Media reports suggest Iran’s Revolutionary Guard has closed the Strait of Hormuz, posing a risk to the movement of oil.
It is unclear if there will be further escalation or spreading of the conflict and its length. For now, oil prices are elevated. Some energy analysts say a prolonged period of oil over $100 per barrel could trigger a 1970s-style energy shock.
On the other hand, if the conflict turns out to be short-lived, then a quick/sharp retreat in oil prices wouldn’t be inconceivable.
Valuation Concerns and Fading Dollar Tailwinds
Meanwhile, extended valuations of US equities, benchmark indices around record highs, and a deterioration in the broader US dollar outlook suggest some of the tailwinds that have led to the outperformance in recent years are starting to fade.
Concerns about worsening US public finances are leading to a reassessment of US dollar assets and a shift toward other assets, including gold.
S&P 500 (Weekly):
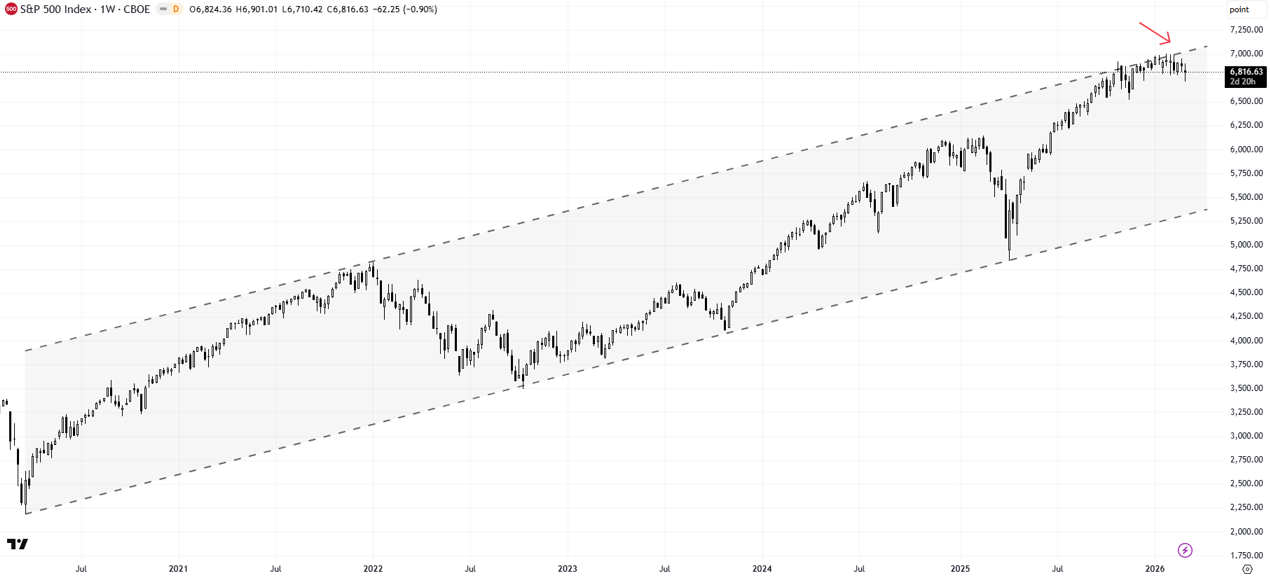
On technical charts, the S&P 500 index has repeatedly tested the upper edge of a rising channel from the Covid-19 low. However, it hasn’t managed to clear the tough barrier.
Indeed, slowing upward momentum suggests the index may have to settle lower before it gathers renewed upward momentum to break past the resistance.
S&P 500 (Daily):
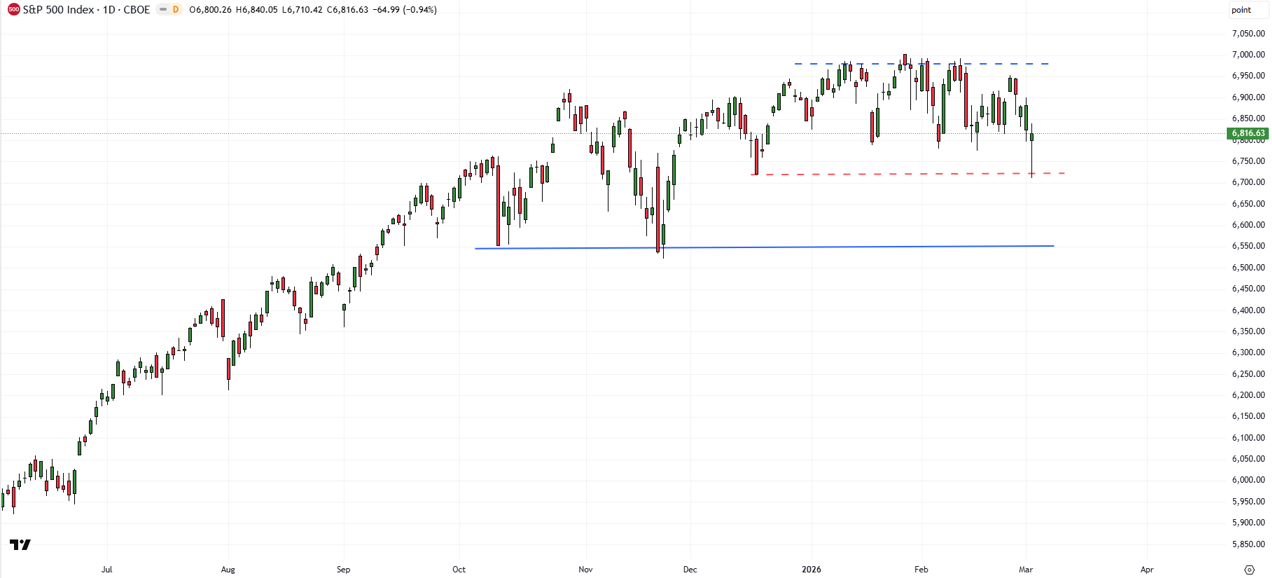
To be fair, despite escalating geopolitical tensions, the index hasn’t broken any meaningful support yet. Key support is at the October low of 6550. This could restrict the retreat, but any break below could pave the way toward the early-2025 high of 6150.
Unless the index cracks below the lower edge of the channel from 2020 (as highlighted in the weekly chart above), the long-term uptrend would remain intact. On the upside, a bullish break above the channel could pave the way initially toward 7500 in the coming months.
S&P 500 Index (Weekly):
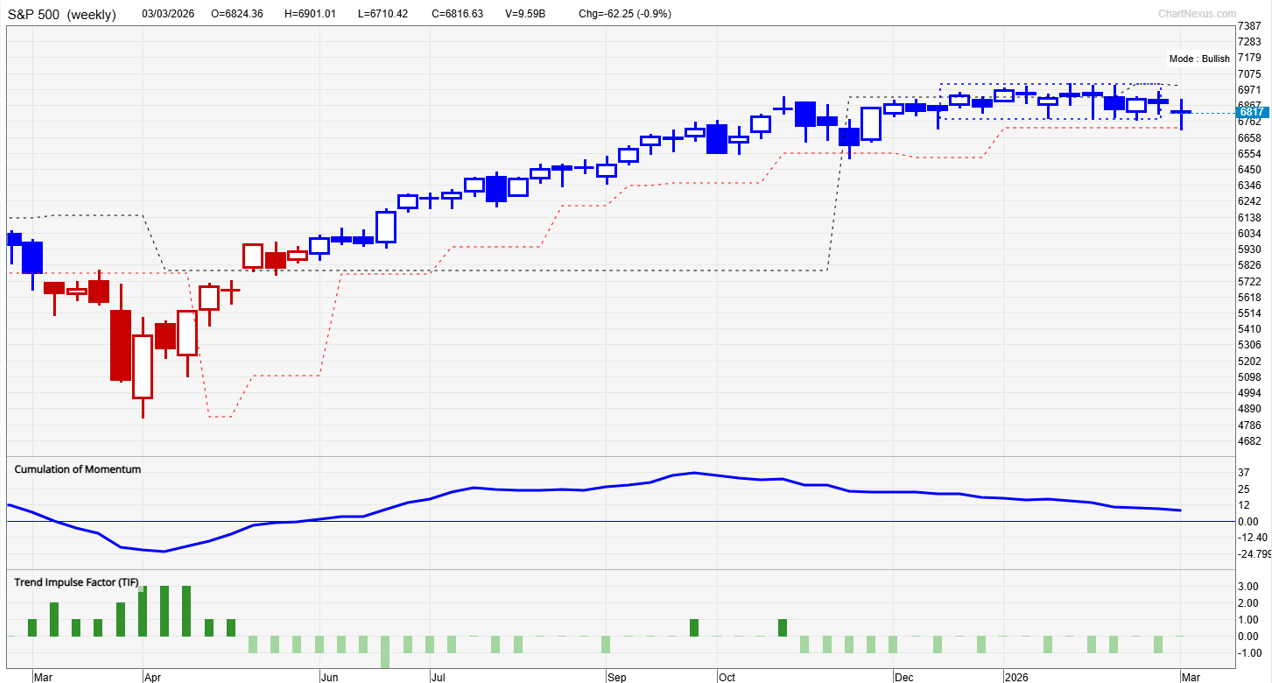
Our proprietary system, TradersGPS (TGPS), remains Bullish on the S&P 500 index on the weekly chart. Blue coloured candles indicate the trend is Bullish; Red coloured candles indicate the trend is Bearish.
The system has been long since the middle of last year.
While geopolitics continues to be a strong near-term driver of risk sentiment, US S&P 500 companies’ earnings growth remains solid. At the end of February, about 96% of the S&P 500 companies reported results, out of which 73% reported positive earnings surprise, according to FactSet.
The estimated year-on-year earnings growth for the S&P 500 has been in double digits for five consecutive quarters. With earnings growth being strong, the downside in equities is likely to be limited.
FAQ
Why are correction risks rising for US equities?
Escalating geopolitical tensions in the Middle East, elevated oil prices, and stretched market valuations are increasing the risk of a short-term pullback.
How could oil prices affect US equities?
A prolonged surge in oil prices could trigger an energy shock similar to the 1970s, which would negatively affect economic growth and equity markets.
What technical level is key for the S&P 500?
The October low around 6550 is an important support level. A break below this could lead to a move toward 6150.
What does TradersGPS signal for the S&P 500?
The TradersGPS system remains bullish on the weekly chart, indicating that the broader trend is still positive.