Systematic Trading (Nov 2021): NVDA & GENTING
“In trading, you have to be defensive and aggressive at the same time. If you are not aggressive, you are not going to make money, and if you are not defensive, you are not going to keep the money.”
– Ray Dalio
Welcome to the third part of our series on Systematic Trading!
In case you haven’t heard, or aren’t sure what systematic trading is about, check out the first part of this series.
In the second part, we looked at the charts of Facebook (now known as Meta Platforms) and SIA (CL6).
Why this series is running is to help you get a sense of how systematic trading works. And, more importantly, whether this might be something useful to you.
When talking about this, I’ll have to showcase some charts so that you can understand it better.
On that note, please note the disclaimer that this is for educational purposes. Do yourself a favour, do your due diligence, do NOT just jump in headfirst into the trade.
The fact is that there is no lack of trading opportunities.
Rather, it’s a matter of finding the best trade set-ups. Such high probability trades would then give you better chances of being right.
More on that later as we take a look at the charts in this article on NVDA and GENTING.

Quick Comments On Stock Selection: NVDA & GENTING
Since we’re getting our toes wet with the recent exploration on the semiconductor industry, I thought it’d be a good idea to follow-up with look at one of the giants in the industry – Nvidia. It’s one of the most well-known players especially in recent times.
As for the other stock selection, with the recent announcement of the vaccinated travel lane between Changi Airport and Kuala Lumpur International Airport, I got inspired to look into this stock in KLSE. This comes after the easing of domestic travel restrictions too, after months of pent-up demand for leisure activities.
After all, it would be good to see how TradersGPS works in these other markets. While screening using TradersGPS would have played an important role in identifying strong companies, and these selections may not have made it into the current list of strong companies to trade… We can still get a feel of the entry and exits just by looking at the chart and signals.
By the way, feel free to leave a comment on your stock suggestions. I might pick them out to highlight in our next article in this series.
Now let’s get on with the charts.

Nvidia Corp. (NASDAQ: NVDA)
1. About The Company
“NVIDIA Corp. engages in the design and manufacture of computer graphics processors, chipsets, and related multimedia software. It operates through the following segments: Graphics Processing Unit (GPU), Tegra Processor, and All Other. The GPU segment comprises of product brands, which aims specialized markets including GeForce for gamers; Quadro for designers; Tesla and DGX for AI data scientists and big data researchers; and GRID for cloud-based visual computing users. The Tegra Processor segment integrates an entire computer onto a single chip, and incorporates GPUs and multi-core CPUs to drive supercomputing for autonomous robots, drones, and cars, as well as for consoles and mobile gaming and entertainment devices. The All Other segment refers to the stock-based compensation expense, corporate infrastructure and support costs, acquisition-related costs, legal settlement costs, and other non-recurring charges. The company was founded by Jen Hsun Huang, Chris A. Malachowsky, and Curtis R. Priem in January 1993 and is headquartered in Santa Clara, CA.”
Source: MarketWatch
2. Position Trading (Daily)
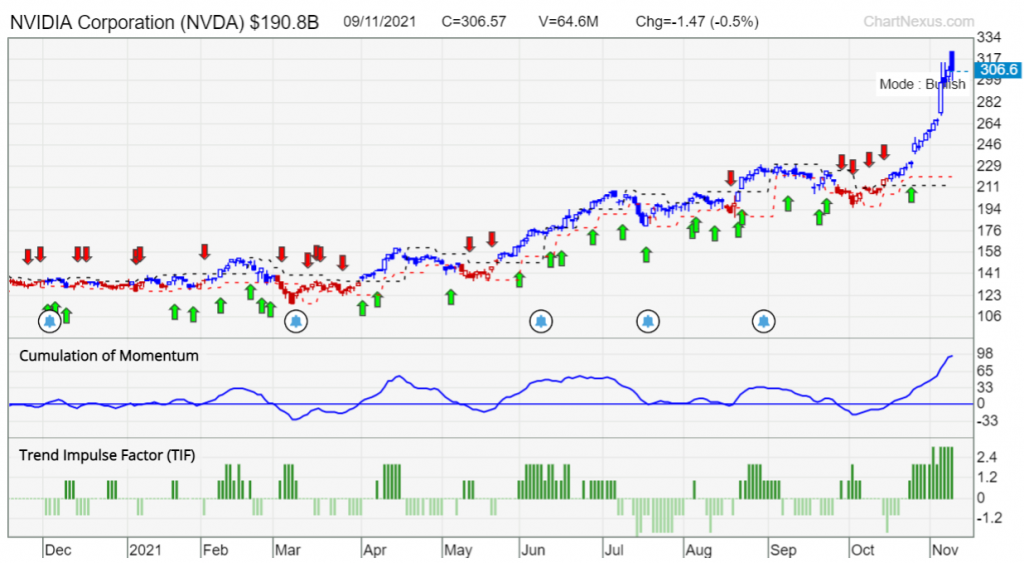
NVDA has been on a steady uptrend this past year, as seen from the higher highs and higher lows in the stock price. For a position daily trade, the latest opportunity to re-enter NVDA appeared recently on 25th October. Seeing the signal, which is the green arrow with dark green bars on the Trend Impulse Factor (TIF), one would proceed to mark the high of that day’s candle.
And, as it turns out, the price gapped up the next day, and has shown no signs of reversing this upward momentum. With an entry around $235 and the current price at $306, that’s an approximate 30% gain over a 2-week period.
3. Swing Trading (Weekly)
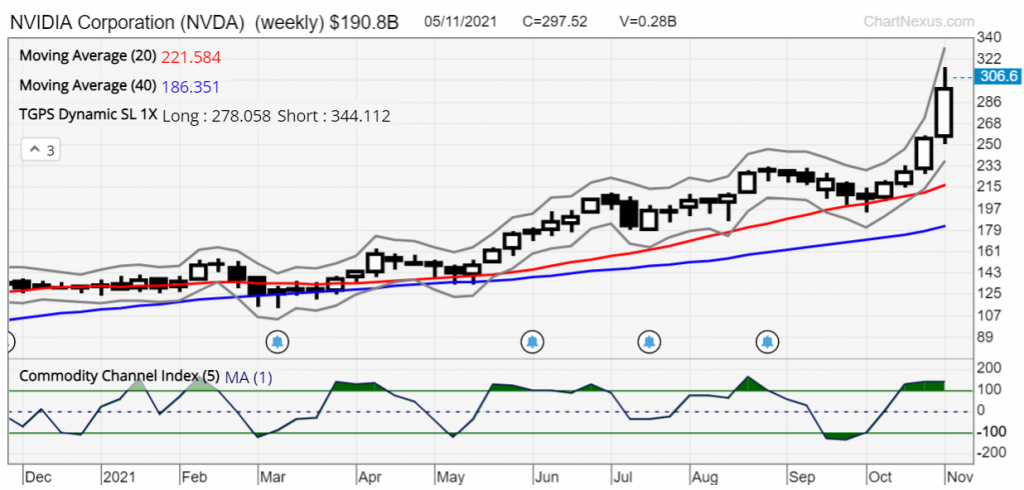
The recent swing set-up would have proven to be a profitable swing trade. While the set-up had appeared in late September, the subsequent week’s candle did not break above the high of the earlier candle. Thus, the trade would not have been triggered.
After continuing to mark the high of the new candle, the trade would be triggered the following week, which is some time during the 2nd week of October. Entering the trade around $215 and with the current price at $306, that is an approximate 42% gain over a month-long period.
4. To Trade Position Daily Or Swing Weekly?
Both trades seem pretty lucrative. The important thing here is to stick by your entry and exit plans, based on the strategy being deployed for the trade. Which is to say, if you’ve entered the trade earlier via the swing weekly strategy, do exit accordingly.
Assuming that I had not already entered into the swing weekly trade in the earlier part of October, I would have gone with the position daily trade. This is in consideration of the risk-to-reward, seeing the stock’s upward momentum and with the view that this may continue.
At this point for position daily trading, there remains room for further entries when subsequent signals appear. Since there has only been 1 signal given off, one may keep a lookout for further signals in the meantime.

Genting Berhad (KLSE: GENTING)
1. About The Company
“Genting Berhad, an investment holding company, engages in leisure and hospitality, oil palm plantation, power generation, oil and gas, property development and management, life sciences, and biotechnology businesses in Malaysia and internationally.”
Source: Simply Wall St.
2. Position Trading (Daily)
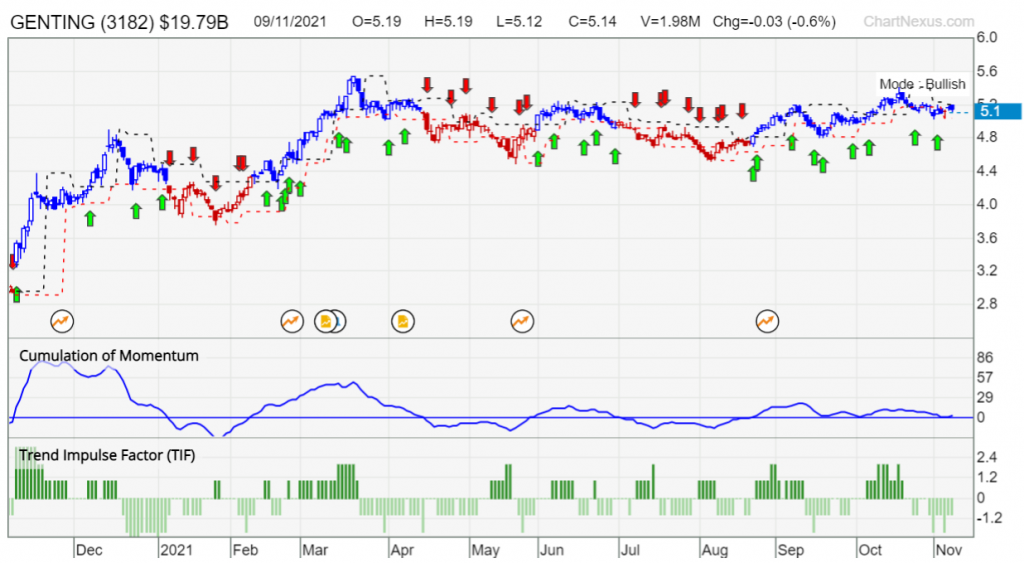
While GENTING appears to have been trending sideways since mid-March, it has been making higher lows since late August. This is a bullish indication it shows more buyers than sellers. This was also the period where entry signals had appeared. If one had started entering then, or adding positions at the subsequent signals, he would still remain in the trade. This is because despite the appearance of a red candle last week, the low was not broken. This means that the exit trade would not be triggered.
Assuming entry in late August around 4.95, the current price at 5.1 provides about a 3.2% gain.
3. Swing Trading (Weekly)
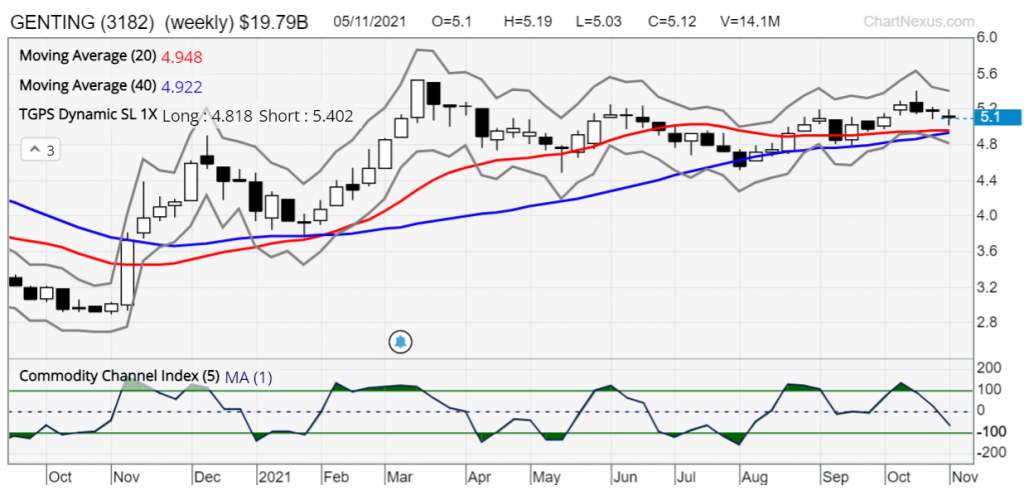
This example shows 2 key takeaways. First is the importance of having a trigger. After identifying a swing set-up in late June, the next step is to mark the high for the trigger to be executed. This marking of high continues and is only triggered 3 candles later in mid-July, above the high of 4.93. Without marking the high, one might have unwittingly entered the trade prematurely.
The next takeaway is to have a stop-loss in place. In which case, by putting a stop-loss at the low of the previous candle, you would have exited with an approximate 5% loss. While the stock rallied afterwards, there is no way of knowing whether this would happen. Therefore, taking the loss to manage the downside would have been a better strategy than hoping that the swing trade would be a profitable one.
4. To Trade Position Daily Or Swing Weekly?
Given that the swing high is still pretty close to the trigger, the risk-to-reward for the swing weekly trade would be less attractive compared to the position daily trade. At the signal in late August, the price is nearer to the support level compared to the resistance, which indicates room to the upside.
Should the price break above the resistance, which it did eventually, this would be a bullish sign to ride this winner into further profits.
Conclusion: Nvidia Corp & Genting Berhad
Having a stock idea is great, and building them into a watchlist is even better. But beyond that, having clarity in your trades is of utmost importance.
Such as the example of NVDA, sticking by the entry and exit based on the strategy is key. This will help you to test and refine that strategy, and deploy it for future trades. When there is a winning formula, then would you have the confidence to rinse and repeat.
While the price movements in GENTING is not as large compared to NVDA, it nevertheless shows that having a system in place provides clarity in trading. And that at times, losses will be incurred, but that is part and parcel of the trading game.
Being able to manage your downside enables longevity in this trading endeavour. Just like the quote at the beginning of this article aptly puts it – besides being aggressive, you need to play defensive as well.
Balancing both aggressive and defensive plays essentially means to focus on the process. In doing so, as we always say, the result will take care of itself.
Swayed by emotions? Unsure when to take action? While discretionary trading is not bad, perhaps systematic trading is what works for you. Discover the intricacies of it as we journey along this series.
If you’d like to learn more about systematic trading to better time your trade entries, click the banner below: