About the Security (NASDAQ: MRNA)
Moderna, Inc. is an American pharmaceutical and biotechnology company based in Cambridge, Massachusetts, that focuses on RNA therapeutics, primarily Messenger RNA vaccines (mRNA).
Stock background:
Moderna shares hit a near two-year high last week on rising optimism toward the company’s product pipeline in the coming years. The optimism was further boosted by the FDA’s Vaccines and Related Biological Products Advisory Committee’s unanimous decision to back the company’s flu shot for adults 50 and above.
Furthermore, the Global Health Organization CEPI will give roughly $60 million to MRNA and two other groups to accelerate the development of shots against Ebola Bundibugyo.
At the Science Day event earlier this week, the company announced the next phase of expansion. Building on the momentum of its four approved products — Spikevax®, mRESVIA®, mNEXSPIKE®, and mCOMBRIAX®– the company aims to drive growth through infectious disease launches, geographic expansion, and the advancement of late-stage pipeline opportunities.
MRNA shares are up over 50% since this column highlighted the possibility of an uptrend. For more details, see “Moderna: Breaks Higher After Preliminary Earnings,” dated 22 January 2026. Our proprietary TradersGPS (TGPS) system says there could be scope for some more gains.
Moderna (Weekly chart):
Technical Analysis on Moderna (NASDAQ: MRNA)
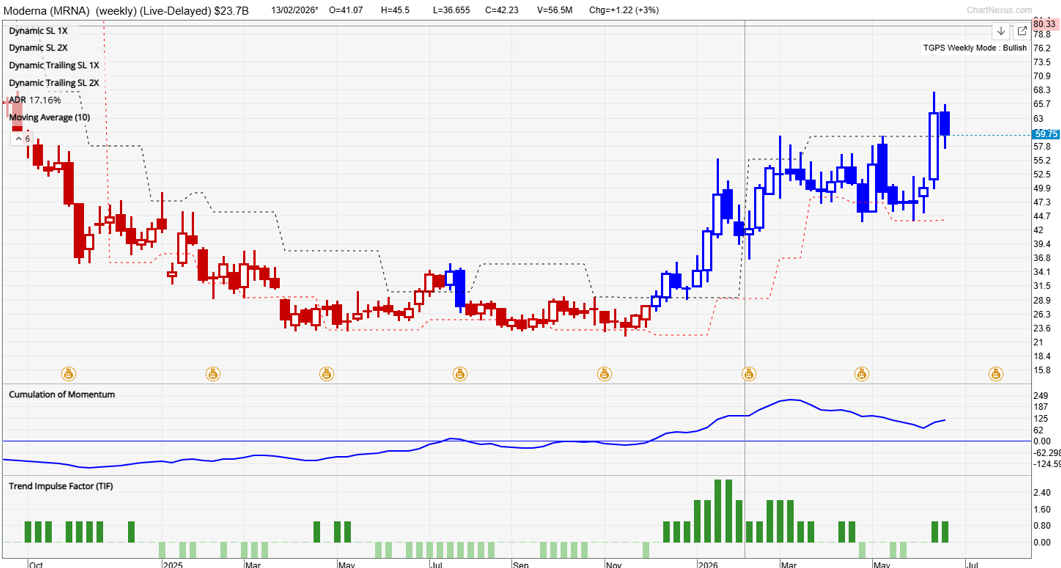
TradersGPS (TGPS) remains bullish on MRNA. As pointed out in January, the system decidedly turned bullish on the weekly charts at the end of 2025. As per our system, Blue candles indicate the stock’s trend is up. Red candles indicate the trend is down.
Depending on the timeframe in which the signal occurs, the implications for the future trend vary. For instance, a signal on the weekly timeframe tends to have implications for the trend over a multi-month timeframe. A noteworthy feature of the system is that it tends to be less sensitive to short-term broader market gyrations.
Despite the tensions in the Middle East, the candle color didn’t change to Red despite the retreat in the broader benchmark indices. As per the system, for the outlook to change to bearish on the weekly chart, the candle colour needs to change to Red.
Moderna (Weekly chart):
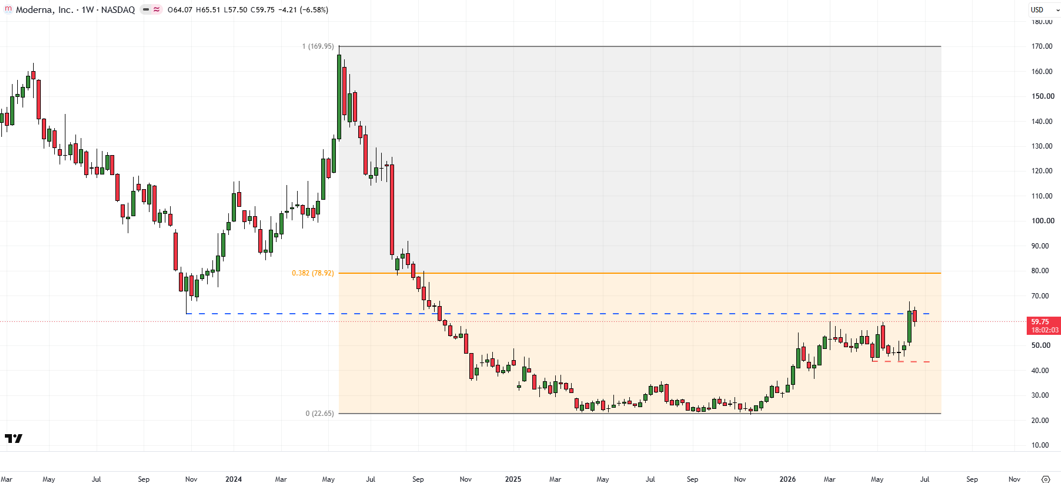
Meanwhile, on the weekly candlestick charts, MRNA appears to have run into a stiff barrier – the October 2023 low of 62.50. Fading upward momentum on the weekly charts suggests it might be tough to crack the resistance, at least in the first attempt.
However, the bullish outlook is unlikely to change while the stock holds above vital support at the April low of 43.65.
Zooming out a bit, the decline has been significant since 2021, which will make it harder for the stock to embark on an uninterrupted major rally. Indeed, the ‘two-steps-forward-one-step-back’ could be a feature of the recovery story.
If the stock does fall below support at 43.65, it would open the route toward the 2025 lows of 22.00.
Trading Strategy:
I would continue to hold on to longs while the candle colour remains Blue.
For some of the reasons mentioned above, I wouldn’t be too optimistic about the extent of gains. The possibility of moderate gains coupled with the defensive nature of the stock would tempt me to stick with longs for the time being.
Would I add to longs?
Probably not, at least not at the current level. I would wait for a dip below 50 to consider dollar cost averaging.