
About the Stock (NASDAQ: MSFT)
Microsoft Corporation is an American multinational technology conglomerate headquartered in Washington.
From the initial days of providing computer operating software like Windows, the company has expanded to internet services, cloud computing, artificial intelligence, gaming, and other businesses, including collaborations with governments and enterprises.
Stock background:
Microsoft shares are down 35% from the record high hit in 2025, ending the quarter on its worst note since the Great Financial Crisis, on concerns regarding the company’s capital expenditure and return on artificial intelligence (AI) infrastructure amid competition from other AI agents.
Looking beyond the recent gyrations, there is very little doubt in the bullish structural story. Being an early leader in AI is transforming the company into a key global infrastructure player for governments and corporations.
Long-Term Growth Story Remains Intact
Moreover, Microsoft remains a dominant player in enterprise software through its Windows operating system and Office. Microsoft reported strong Q2-26 results in January, with revenue rising 17% on-year and earnings per share surpassing market expectations.
While it is too soon to say if the negatives have been priced in, the stock is approaching a major support area, pointing to some stabilization/rebound given the significant decline in recent months.
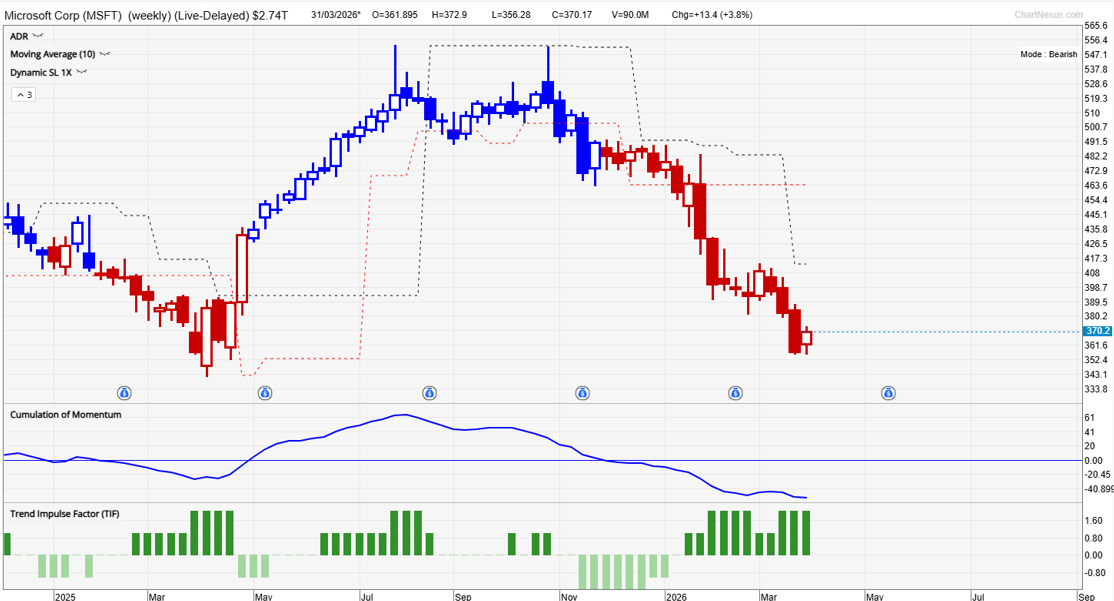
MSFT (Weekly):
Technical Analysis on Nucor Corporation (NASDAQ: MSFT)
Our TradersGPS (TGPS) system turned bearish on Microsoft shares on the weekly chart in November 2025, capturing the downtrend smartly. Blue candles indicate the stock’s trend is up. Red candles indicate the trend is down.
Since December, the candle colour has remained red, a reflection of the downtrend. On the daily chart, the candle colour continues to remain Red, suggesting the stock’s downtrend hasn’t terminated just yet.
MSFT (Weekly):
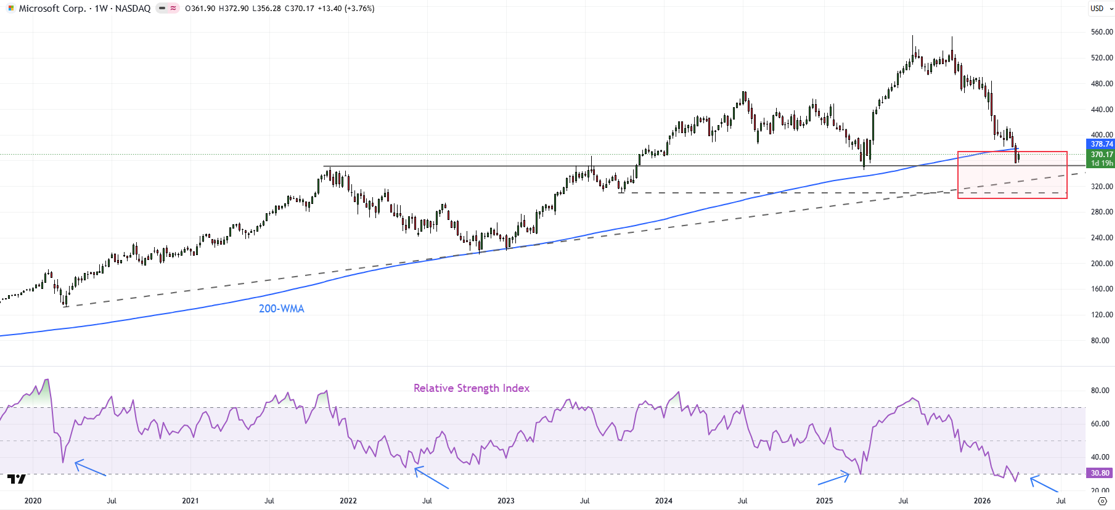
Chart Source: TradingView
Approaching Major Support Zone
Microsoft is now testing major converged support – the April 2025 low, the November 2021 high, slightly above an uptrend line from 2020. It is now under the 200-week moving average for the first time since 2011. Deeply oversold conditions – 14-week Relative Strength Index (RSI) is around 30 levels – point to some stabilization in the stock.
On previous instances, whenever the RSI has approached similar levels, there has been some sort of a rebound in the stock.
MSFT (Daily):
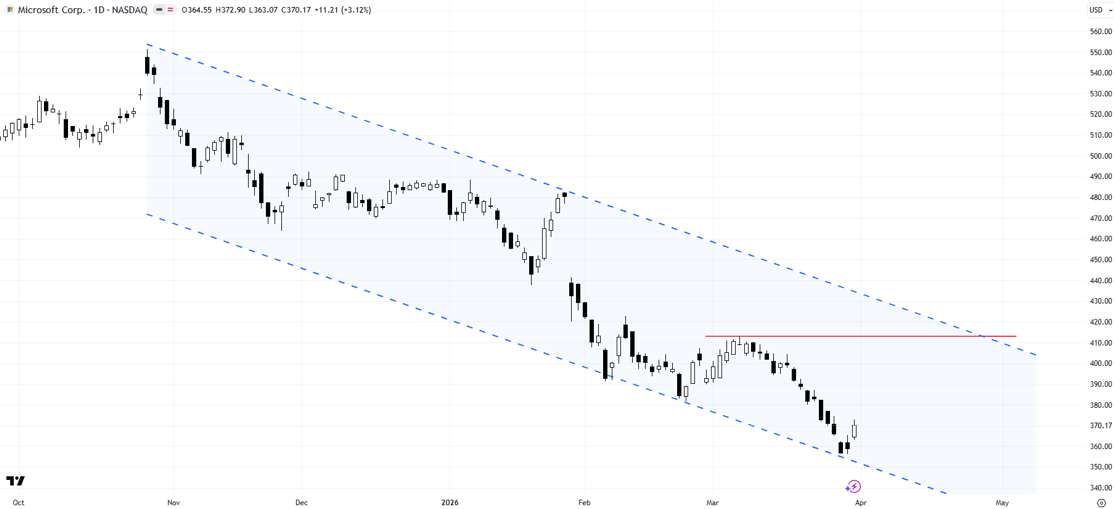
Our TGPS system remains bearish on the daily and the weekly chart. It might be prudent to wait for our system to turn bullish, i.e., the candle colour to turn Blue, for confirmation that the stock has bottomed.
However, aggressive long-term investors might want to use the 35% drop in Microsoft shares to look at it constructively, given that the stock is approaching major support levels.
On the upside, the stock needs to, at minimum, break above immediate resistance at the March high of 413 to confirm that the worst is over. A stronger signal would be a break above the downtrend channel from the end of 2025.
On the downside, falling below 345 could open the door toward the September 2025 low of 310, risking a deeper setback.
FAQ
Why has Microsoft stock declined recently?
Concerns over AI capital expenditure, competition from other AI players, and valuation pressures have driven the recent 35% decline.
Is Microsoft still a strong long-term investment?
Yes. Microsoft remains a dominant player in AI infrastructure, enterprise software, and cloud computing with strong long-term growth potential.
What does TradersGPS indicate for MSFT?
The TradersGPS system remains bearish on both weekly and daily charts, indicating the downtrend is still intact.
What resistance level confirms recovery?
A break above 413 would be an early signal that downside risks are fading.
Where are the key support levels?
Support lies near 345, with further downside risk toward 310 if this level breaks.