5 Stock Market Movement And Cycle
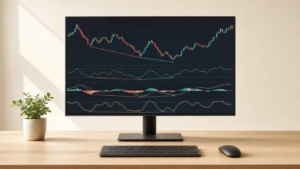
At times, the stock market seems to have a life of its own. We liken it to a roller coaster ride, soaring to the moon and plummeting parabolically on extremes. Yet at times the stock’s ascent feels excruciatingly slow to watch, and at other times we simply wonder where it’s trying to go.
While it is impossible to predict the exact movements of the market, there are certain movements and cycles which aid us in this journey of trading and investing.
So in this article, we take a look at what these movements and cycles are in a bid to help us understand this seemingly manic-depressive behaviour.
And now, onto the first thing that you would need to know about the movements and cycles of the stock market.

1. Market vs Economy
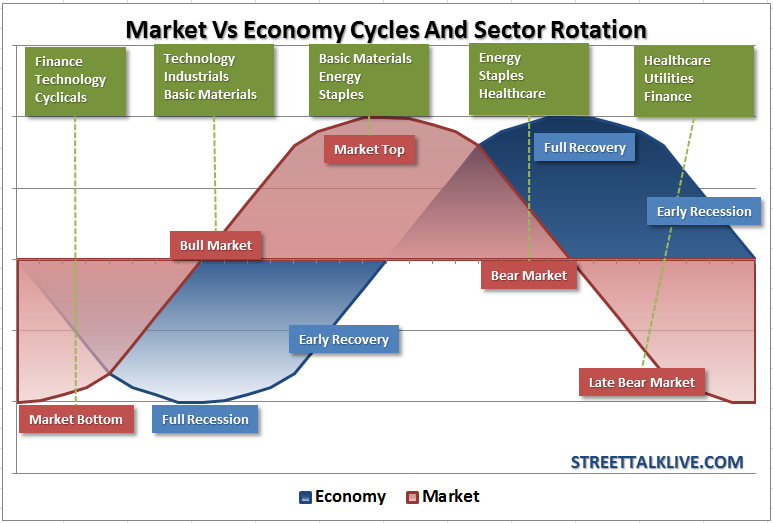
First and foremost is the macro understanding that the stock market does not move in accordance to the economy. The stock market is actually a leading indicator (Source: Investopedia.com) – approximately 3 to 6 months – of the economy.
For instance, when it is a full recession in the economy, the stock market is in a bull market as it is ahead of the economy. The reverse holds true – when the economy is in full recovery, the stock market would be in a bear market.
What about now? Where are we in the market cycle?
Well, the market continues to be bullish, and the economy is still recovering from last year’s COVID crash. However, note that the market does not move continuously in a straight line as in the illustration above. As you will realize, there are smaller movements and cycles ongoing within the broader market direction.
To better understand how it moves, we continue on to the subsequent points on the tide, wave and ripple.
2. Tide, Wave & Ripple
“The trend is your friend” is the golden rule when it comes to trading.
However, there are actually 3 trends at any point in time – the primary, secondary/intermediate, and minor trend. According to the Dow Theory (https://tradingstrategyguides.com/dow-theory-trading-strategy/), these are also called the tide, wave and ripple.
The distinction between the 3 lies with the timeframe.
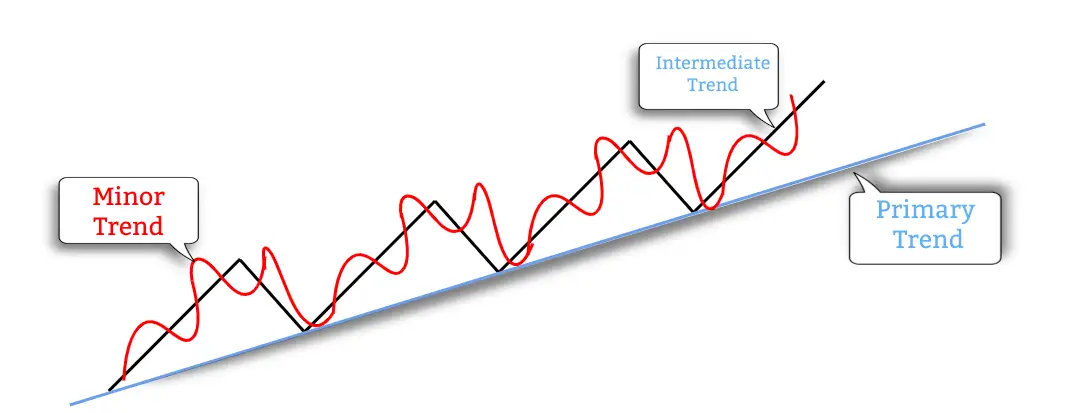
The tide, or primary trend, is the big picture of where the stock is headed. When viewing this trend, the timeframe would minimally be a year, and viewed either on the daily or weekly charts.
The wave, or secondary trend, includes counter-trend movements against the tide. These typically last between 3 weeks to 3 months. Such counter-trend movements are also known as a correction, retracement, or pullback. Seen from the bigger picture, these are healthy movements as the stock does not move in a straight line upwards/downwards.
Lastly, the ripple, or minor trend, can be seen in a similar relationship to the wave, as what the wave is to the tide. These are the even smaller movements which last between 3 days to 3 weeks. Ripples are also thought of as the day-to-day fluctuations in the stock prices.

Application When Trading
To know whether you are following the trend, you would first need to identify your trading timeframe. If you are trading on a longer term such as for more than a year, then you should be less concerned about the ripples which occur. In fact, trading on a timeframe as short as the ripples has been noted to be erratic and difficult to achieve with consistency.
In the case of an uptrend, the waves should be making higher highs and higher lows. When viewed on a longer timeframe, the tide will therefore continue to slope upwards. The reverse is true in a downtrend as well, with the waves making lower highs and lower lows.
A simple way to identify the trend is by looking at the slope of the simple moving average (MA). While there are countless options of technical indicators, the MA is easy and powerful to utilize.
Common choices are the 50-day MA to identify waves for the mid-term trend, and the 200-day MA to identify the long-term tide. When the 50-day MA crosses over the 200-day MA, this signifies that the stock is moving into an uptrend. Similarly, when the 50-day MA crosses below the 200-day MA, this signifies that a downtrend has arrived.

3. Support & Resistance
Besides trending upwards (making higher highs and higher lows) and downwards (making lower highs and lower lows), stocks also spend their time trending sideways. This is also known as a consolidation, accumulation/distribution, or trading in a range.
In such situations, we can identify the upper range as the resistance, and the lower range as the support. They can be thought of as the ceiling and floor respectively.
While it is possible to trade the range, there are also no guarantees that the stock wouldn’t break above the ceiling or break beneath the floor. When prices are closer to these support and resistance levels, it is also when the bulls and bears are fighting with their backs against the wall to maintain the price levels.
Nonetheless, support and resistance levels are also healthy phases in a stock’s trajectory. This is because this is likely the time where institutions are accumulating shares (Investopedia.com). The longer this period holds, the stronger these support and resistance levels are.

4. Sector Rotations
If you noticed in the earlier illustration on the market cycle, there are sectors listed at the top of each of the different phases. This is because at different points of the cycle, the funds actually flow to these sectors in anticipation of the next stage of the economic cycle. These sectors tend to perform best in that next cycle.
For instance, in the early recovery phase, the economy is picking up and consumer expectations begin to rise. Industrial production grows, and interest rates have bottomed out.
Where possible, it is wise to follow the flow of the money rather than trying to go against it. While this doesn’t mean that you should liquidate all your positions, it pays to keep an eye on where the funds are flowing and to follow it.
After all, the trend is your friend.
Do note that the above illustration does not include all 11 key sectors. If you’re interested to find out more about this subject, do check out this recent article on the best sector stocks that we’ve identified.

5. Seasonality
Sayings like “sell in May and go away” or being more cautious due to the “September Effect” have their roots in the concept of seasonality.
Seasonality looks at the data over year-long periods, and identifies predictable changes or regular patterns that recur on an annual basis. While there are no guarantees that this year would be the same as previous years, it is also possible to gather clues from the stock’s history.
How seasonality affects stock prices could be due to calendar seasons like summer or winter, or commercial periods such as the holidays. For instance, retail sales would likely perform better during the gifting seasons or when mass sales periods are conducted such as Amazon Prime Day or Alibaba’s 11.11 Singles’ Day.
One of the places you could check out a stock’s seasonality chart would be StockCharts. Simply key in the stock’s ticker symbol in the seasonality field to see how it has performed.
Conclusion: What Causes Stock Market Movements?
Now that we have established some of the movements and cycles of the market, let’s put this knowledge into application. Taking a look at Apple’s daily chart over a 1-year period, what do you see?

- What is the tide, wave and ripple?
- When was the period of consolidation? What were the support and resistance levels?
- What sector is Apple in? When does it normally do well in relation to the economic cycle?
- Seasonally, when does Apple perform the best?
I hope this exercise has been useful for you. As you scan for the most ideal stocks, these are some of the factors to consider before executing the trade.
While it may seem overwhelming in the beginning, repeating this exercise will train your perception of the stock’s price actions, ultimately enabling you to make better trading decisions.
In fact, we’re just getting started here. There are more interesting topics lined up, which aim to provide you insights into this valuable life skill.
Till the next part of this series, do get yourself familiarized with these movements and cycles in the meantime.
Can anybody start trading and investing on their own? If you’ve read up to this point, the answer is a resounding yes. Stay tuned to the next parts of the series as we adopt a systematic approach in generating a step-by-step beginner’s guide.
If you’d like to get a FREE e-course and learn how to better time your trade entries, click the banner below: