High Probability Triangle Strategy
Triangles are a very common phenomenon that’s popular in charting technical analysis.
Generally, when prices move in an upward trajectory in an uptrend, there will be periods of resting, because no stock can keep going up in a straight-line all the time.
It is during this period of rest, that triangles could be formed!
Some triangles are bullish in nature and some are bearish.
But did you know that this pattern works great on an upside breakout in a bullish trend, and vice versa in a bearish trend?
In fact, you might not know that the type of triangle does not matter as much. Whether it is a descending triangle (typically bearish), an ascending triangle (typically bullish) or a pennant, the context of the trend is most important and key.
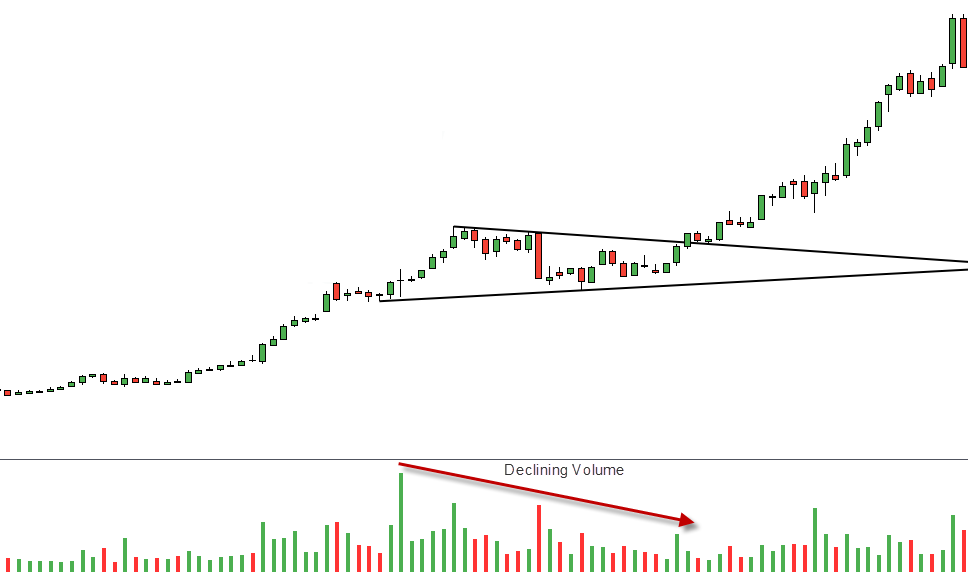
Here is how a triangle could look like in an uptrend:
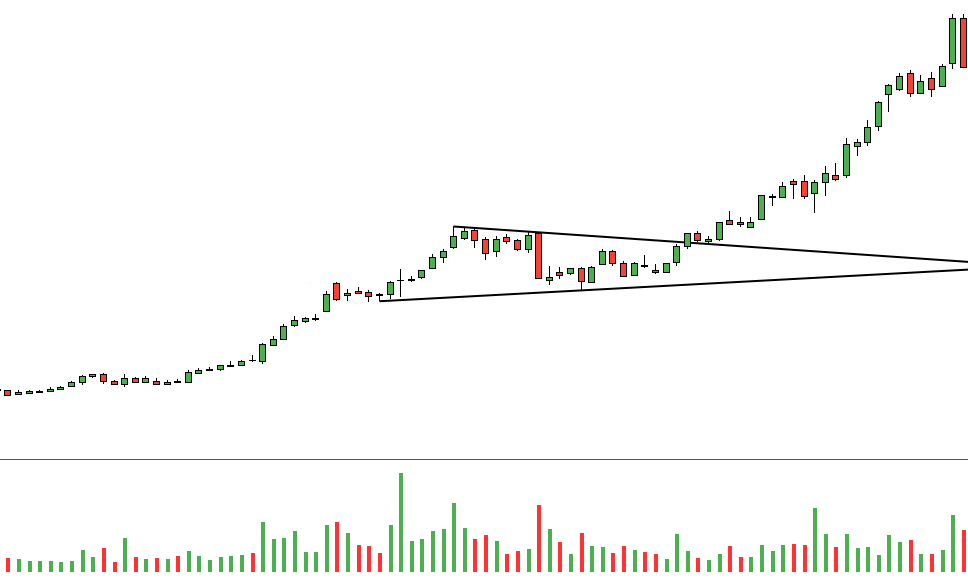
Notice that to get a well-defined triangle, you need to have at least 2 touches on the upper trend-line, and 2 touches on the lower trend-line.
This is a textbook classical TA charting pattern, but as we all know, standard patterns don’t always work well in the markets. Trading with just the standard pattern will yield you only an average success rate.
We need to add on some beef to the classic set-up so that you can trade triangles with much more probability and confidence.
Here are some additional pro tips to supplement the classic setup:
#1 Long & Short Use
Use on up-trending markets for long, and down-trending markets for short.
Sounds simple, but most don’t follow this important rule.
If you just pull out a naked chart, you can draw many kinds of lines, patterns, and even animals on it, so if you don’t have the trend context in mind, you’ll just be trading anything and anywhere.
Trading a pattern on the long side via a down-trending market is equivalent to trading suicide, and you should never be doing that.
Having this filter of trading along with the trend will massively stack the odds in your favour.
#2 Prices Must Touch 2x
It’s the minimum criteria that prices must touch 2x on each side of the trend-line.
Here are the circles pin-pointing the touches. *Note that this is a minimum criteria*
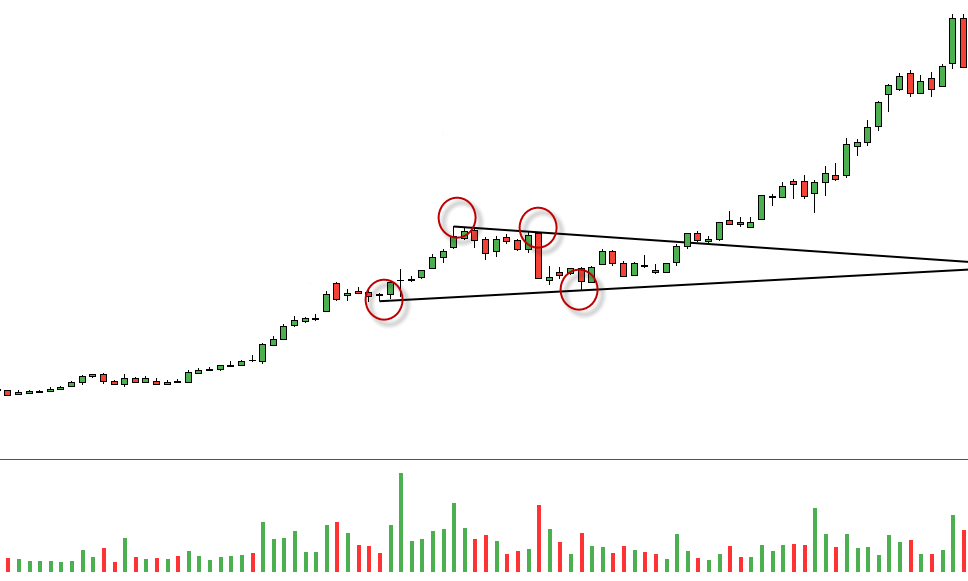
We need at least 2 touches on each side in order to validate and make sure the pattern is good.
Of course the if there’s 3 or 4 touches that’s even better!
#3 Check The Volume
Volume should decline as prices move towards the apex.
Generally for triangles, as prices move to the apex, we want to see volume declining to show a lack of selling in the particular stock before it breaks out.
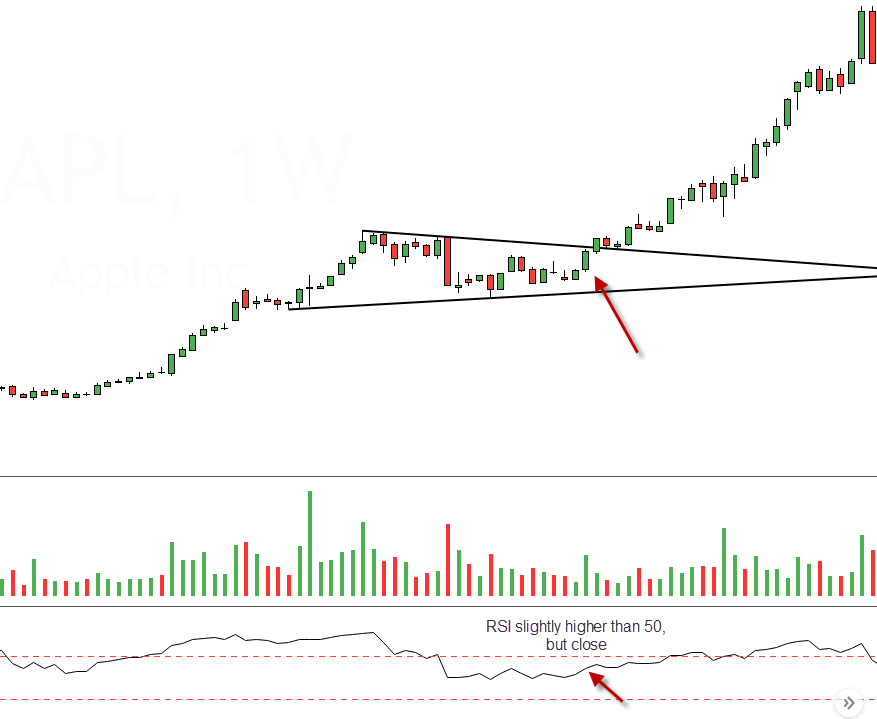
#4 Keep A Close Eye On RSI Indicator
RSI indicator should not be over-bought and close to 50 level (neutral).
The RSI indicator is a momentum oscillator that measures the speed and change of price movements.
It oscillates between 0 and 100, with 30 being “oversold” (price statistically low) and 70 being “overbought” (price statistically high)
We want the RSI to be around or close to the 50 level before the triangle breakout, so that we know that there is likely more movement and momentum in the direction we will be trading towards.
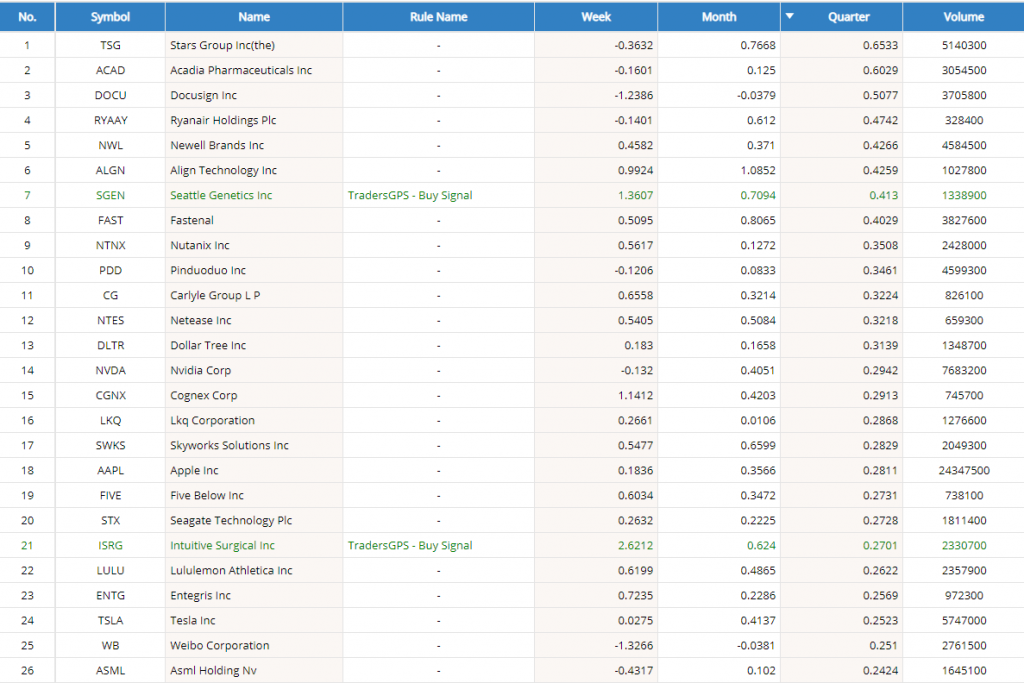
#5 Trade Leaders In The Market
Trade stocks that are leaders in the market (Comparatively Strong for Long, or Comparative Weak for Shorting).
The adage, “you are only as good as the stocks you trade” is very true.
Along with trading with the trend as one of the most important tenets, trading strong stocks on the upside and trading weak stocks to the downside is the name of the game.
You can’t be possibly randomly plucking a stock from no where and trading it without knowing whether it is in play based on it’s strength.
Here we use a screener to help us sieve out candidates quickly and easily:-
An Example Trade On UNH (United Health Group *Strong Stock*)
Here’s an example trade of UNH with all elements tied together.
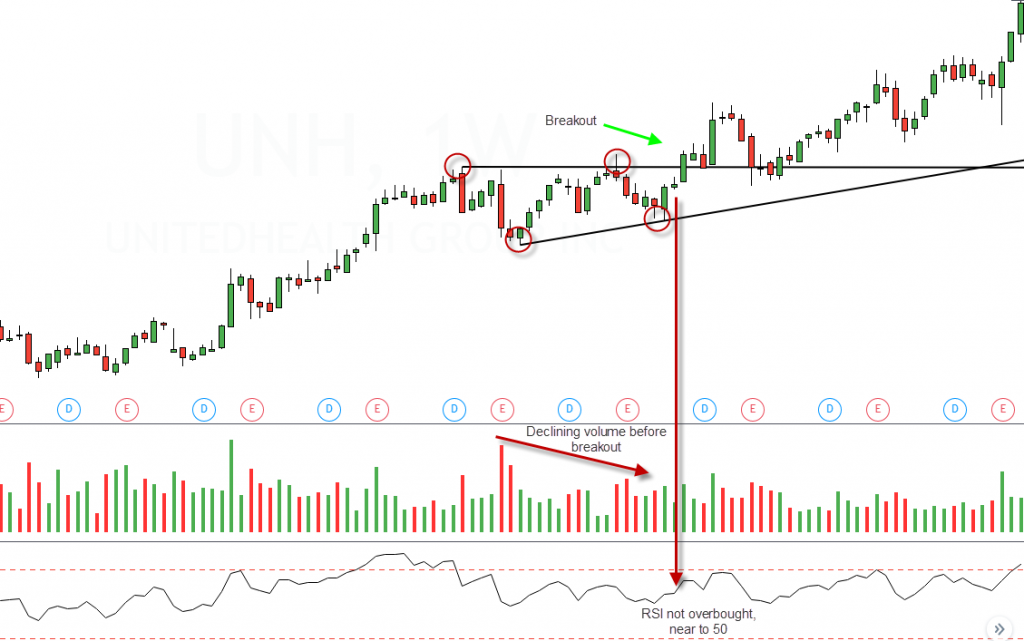
We have an up-trending stock that’s comparatively strong, with minimum 2 touches on each side of the trend-line, declining volume towards the apex, and an RSI that’s near to 50.
The result is a high-probability upside breakout that even though tested our patience by returning to the support line, it eventually moved significantly in our way.
Conclusion: Triangle Pattern Trading
So that’s all folks for trading triangles..
The tips above will help you ascend your prowess of trading triangles in the markets like a pro!
If you would like to double or triple your trading skills in as short a time span as possible, join us for the upcoming Systematic Trading Profits workshop below.
Have an awesome week ahead!