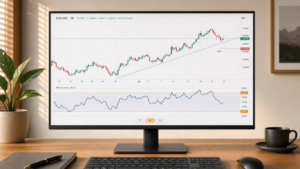
I treat economic data releases as trading signals to test – not instructions to buy or sell. My starting point: compare the actual result with the forecast, then check whether the price move can cover spreads, fees and slippage.
In this guide, I explain how I:
- Track releases in Singapore Time (UTC+8) and use only information available before each trading decision.
- Measure surprises, check revisions and separate price direction, volatility and broader market conditions.
- Test reactions across currencies, bonds, shares and commodities, including how US policy and MAS affect USD/SGD.
- Backtest entry and exit rules with trading costs at 1×, 2× and 3× the baseline estimate.
- Set loss limits in S$, check total exposure and record fills, costs and rule breaches.
My bottom line: a market reaction is not proof of a profitable trade. I test the workflow before risking capital – and keep no trade as an option.
Measure Surprises and Interpret Market Reactions
Calculate Raw and Standardised Surprises
Once the event calendar is fixed, give each release a comparable surprise score. Measure the forecast error, not the headline reading. Keep the release’s official units and definition consistent throughout.
To standardise scores, use the historical standard deviation of surprises, not actual readings. Calculate it using only observations available before the release. Full-sample estimates leak future information.
| Measure | Calculation | Best use | Main limitation |
|---|---|---|---|
| Raw surprise | Actual − Forecast | Keeps the result in jobs, index points or percentage points | Different indicator scales cannot be compared directly |
| Relative surprise | (Actual − Forecast) / |Forecast| × 100 | Shows the difference relative to the forecast’s size | Unstable near zero; negative forecasts are still awkward to interpret |
| Standardised surprise | (Actual − Forecast) / Historical standard deviation of surprises | Compares surprise strength across indicators | Needs enough comparable prior observations |
Set the estimation window and minimum observation count before testing. If history is too short, keep the raw surprise and mark the standardised score as unavailable.
Never divide by zero or near-zero dispersion. Use a predefined floor or a documented measure that resists outliers. If the methodology changes, start a new history or document an adjustment. A standardised score of +2 means the release came in two historical surprise standard deviations above forecast.
Assess Revisions and Report Details
Record the revision delta separately, and store the data vintage used in each test. Choose one way to handle revisions before testing and stick to it.
Track the forecast timestamp, outlier flags and subcomponents too. In employment reports, wages, hours and participation can change the policy message. Assign the expected direction separately for each traded instrument.
Hypothetical wage calculation: Average hourly earnings growth rises from 4.0% to 4.3% year on year, against a 4.1% forecast. The surprise is +0.2 percentage points; the relative percentage surprise is approximately 4.9%. Growth increased by 0.3 percentage points from the previous reading. Stronger wages may suggest inflation pressure, but weaker employment, fewer hours or downward revisions can soften that interpretation.
Map Signals Across Asset Classes
After scoring the surprise, test its effect on rates, FX, equities and commodities for each instrument and regime type. Treat the matrix below as a research hypothesis, not an entry rule. Priced-in expectations, report details and regime shifts can reverse the expected reaction.
| Event and surprise | Conditional policy interpretation | Rates | Currency | Equities | Commodities | Credit | What can invalidate it |
|---|---|---|---|---|---|---|---|
| Inflation above forecast | More restrictive policy expected | Yields may rise; prices may fall | Currency may strengthen | Rate-sensitive shares may weaken | Gold may fall on higher real yields | Spreads may widen | The central bank looks through supply-driven inflation |
| Inflation below forecast | Less restrictive policy expected | Yields may fall; prices may rise | Currency may weaken | Rate-sensitive shares may benefit | Gold may benefit from lower real yields | Spreads may tighten | Deflation signals recession |
| Growth above forecast | Stronger demand expected | Yields may rise | Currency may strengthen | Cyclicals may outperform | Industrial commodities may rise | Spreads may tighten | Strong growth implies aggressive tightening |
| Growth below forecast | Weaker demand expected | Yields may fall initially | Currency may weaken, or strengthen as a safe haven | Cyclicals may fall | Industrial commodities may fall | Spreads may widen | Expected aggressive easing dominates the reaction |
| Employment above forecast with wages above forecast | Strong growth and possible inflation pressure | Yields may rise | Currency may strengthen | Mixed: cyclicals supported, rate-sensitive shares pressured | Demand-sensitive commodities may rise | Spreads may tighten initially | Revisions are sharply negative |
USD/SGD is a relative-policy trade, not a one-country inflation trade. MAS manages monetary policy mainly through the Singapore dollar nominal effective exchange rate (S$NEER). It steers a trade-weighted currency basket within a band, adjusting the band’s slope, width or centre rather than setting a conventional domestic policy interest rate.
Strong Singapore inflation may support SGD. But US strength at the same time, or a MAS response already reflected in prices, can offset that effect. Analyse USD/SGD alongside US yields, regional FX and S$NEER conditions. Test relative-value signals with comparable standardised Singapore and US surprises, while keeping in mind that bilateral USD/SGD is not the S$NEER.
Define measurement windows before testing – for example, one minute before to five minutes after release, followed by five to 30 minutes. Use synchronised timestamps and account for the instrument’s trading hours. Alongside returns, record bid–ask spreads, high–low excursions, volume and maximum adverse excursion.
Initial moves can reverse as traders work through the details. Test direction separately for each instrument and regime type. Reject the template when overlapping releases, poor liquidity or a changed policy regime make the historical relationship unreliable. Use these reaction windows to set backtest entry and exit rules.
Master Systematic Trading with Collin Seow
Learn proven trading strategies, improve your market timing, and achieve financial success with our expert-led courses and resources.
sbb-itb-466c9b0
Backtest Economic Release Signals
Define Data, Entry and Exit Rules
Turn the release signal into a trading test without look-ahead bias. Set the research rules before viewing returns. Define the event universe, instrument and data source. Record scheduled release and publication timestamps, the current median forecast, first-release actual, prior value and revision. Set the surprise formula, entry delay, holding period, exit rule, position sizing and benchmark.
Store only information available at decision time. Key each observation to the release date, not the reference date, and keep both original and Singapore timestamps. ALFRED and other real-time vintage databases preserve historical data versions so you can test what was known when a trade could have been placed. Keep the surprise score and reaction window defined earlier as fixed backtest inputs.
Choose one of four entry models before testing.
| Entry model | Required inputs | Bias controlled |
|---|---|---|
| Pre-release | Position timestamp, scheduled release time, prior information set, entry price and news blackout window | Prevents treating the release outcome as known before entry |
| Immediate | Publication timestamp, forecast and actual availability times, first executable bid or ask after fixed latency | Prevents using a pre-release or mid-market price unavailable after the announcement |
| Delayed | Defined delay and executable quote at its endpoint | Tests whether the signal survives realistic reaction time |
| Confirmation | Confirmation condition, observation window, price or cross-asset filter and last permitted entry time | Prevents choosing favourable confirmation after seeing the outcome |
Exclude observations with missing or unclear publication times. Don’t assign a convenient timestamp.
Model Trading Costs and Execution Limits
Use executable bid-ask prices, not chart prices. Include spreads, commissions, exchange and clearing fees, slippage, latency, market impact, fill rate, order size, liquidity and any currency conversion costs. Test costs at one, two and three times the baseline estimate.
Account for trading hours, Singapore and overseas public holidays, market closures, exchange limits, contract rolls, overnight financing and overlapping releases. A continuous futures series is not itself a tradable contract.
Set stop, target and time-exit rules before testing. When prices gap through a stop, use the first available price – not automatically the stop level. If one bar hits both the stop and target, assume the worse fill unless finer data confirm which came first. For limit orders, require a trade-through by the specified amount or use a conservative partial-fill rule.
Size positions as cash risk ÷ (stop distance × unit value), then cap notional exposure, leverage and liquidity. Recalculate risk when exchange rates affect a non-SGD instrument. Include fees and expected slippage in the risk budget: a stop does not guarantee a maximum loss.
Test Performance Across Samples and Settings
Once execution rules are fixed, test them only on unseen data. Split the sample chronologically into development, validation and final test periods. Keep parameter tuning separate from final performance measurement.
In each walk-forward cycle, estimate parameters using earlier data, fix the settings after validation, then test the next unseen period. Report only out-of-sample results.
Test nearby thresholds, reaction windows, normalisation periods and latency assumptions – not just the best combination. Use one documented rule to test with and without outliers, and report both results. Log every tested specification so data-snooping bias is visible.
Report event and trade counts, wins and losses, hit rate, average and median return, return volatility, maximum drawdown, profit factor, turnover and holding time, before and after costs. Break results down by event, instrument, direction, surprise bucket, market regime, time of day and entry type. Include equal-weighted event returns alongside portfolio-level results so frequent events don’t automatically dominate.
Use confidence intervals or bootstrap ranges to show small-sample uncertainty. Report the percentage of events with unavailable or partial fills. Several trades from one announcement are not independent evidence: cluster by event date or use block bootstrap, account for overlapping exposure, and compare results against a preselected no-signal benchmark.
Then forward-test execution and order handling. Paper fills alone do not prove live profitability.
Set Risk Rules Before Each Release
Once the backtest passes, lock in the same execution and risk rules before the next release.
Choose How to Handle Event Exposure
Set your exposure policy before submitting orders. Specify the instrument, size, leverage, order type, entry window, exit rule and cancellation rule. Leverage magnifies gains and losses. In leveraged foreign-exchange trading, losses can exceed your initial margin, and you may need to add funds.
| Approach | Benefits | Risks | Implementation requirements |
|---|---|---|---|
| Event avoidance | Removes scheduled announcement risk, gap risk and much of the risk from widening spreads | You may miss profitable moves or have to close a position at an unfavourable price before the release | Maintain an event calendar, set a deadline for closing positions and confirm that all related orders have been cancelled or reduced |
| Reduced exposure | Keeps some participation while lowering notional and margin risk | Smaller positions can still suffer slippage; correlated trades may leave total exposure largely unchanged | Cap position size as a proportion of normal size, calculate total currency or regional exposure and check available margin |
| Delayed entry | Avoids the first price shock and gives spreads and liquidity time to stabilise; later trades can account for release details and revisions | The initial move may be over, the market may reverse, or you may enter at a worse price | Set a waiting period, minimum liquidity or spread requirement, confirmation rules and a deadline for signal expiry |
| Hedging | Can reduce directional exposure when closing is impractical or costly | Adds costs, basis risk and imperfect offsets | Specify the hedge instrument, hedge ratio, maximum hedge cost, duration and exit rules for both positions |
With the exposure model fixed, set hard loss limits and no-trade triggers.
Define Loss Limits and No-Trade Conditions
Set planned risk per trade in S$, then cap total currency, regional and common-factor exposure. Treat correlated positions as one risk cluster, rather than giving each a separate allowance.
Set daily and weekly loss thresholds that stop new entries. Specify how to reduce existing exposure if margin or liquidity deteriorates. For clustered releases, limit simultaneous positions, set minimum spacing between entries and fix a deadline for reducing exposure before the next announcement.
Set a time exit and exact conditions that invalidate the trade. These might include price crossing a defined pre-release boundary, a yield move reversing beyond a set threshold, or a related currency index failing to confirm the initial direction.
Block new orders when data, feeds, spreads, depth, margin or prices breach pre-set limits. Give each filter a measurable threshold and clear instructions to hold, reduce or close existing positions. Base thresholds on tested conditions, not a universal percentage. Label every numerical risk example as hypothetical.
Log Events and Review Trading Decisions
Record forecasts, actuals, revisions, surprise scores, data vintages, and scheduled versus actual timestamps. For Singapore-based logs, record release times in SGT. Use S$ for monetary values, with clear decimal and thousands separators.
Timestamp format: 2 October 2026, 8:30 pm SGT
Log positions, leverage, correlated exposure, quotes, fills, slippage, hedges, market reactions, costs and exit reasons. Review compliance separately from profitability: distinguish signal errors, execution problems, feed failures and rule breaches.
Conclusion: Economic Release Trading Checklist
Before risking capital, check that you have an auditable calendar, point-in-time data, surprise scores, a process for handling revisions, and predefined risk rules. Use only data available when you make the decision. Revised data can make your apparent edge look stronger than it was.
Once those checks pass, test whether you can trade the reaction profitably after costs. Treat cross-asset moves as confirmation, not entry signals. Test two things separately: whether the surprise moves the market, and whether trading that move remains profitable after spreads, commissions, slippage and delays.
Before trading live, paper-test the full workflow across multiple release cycles. Start with one or two liquid, recurring releases. Compare fills, costs and drawdowns against your backtest. Investigate any gaps before putting capital at risk.
A release may offer no edge, reverse quickly or already be priced in. No trade is a valid outcome. Backtests are hypothetical; past performance does not guarantee future results.
FAQs
Which economic releases should I test first?
Focus on high-impact, three-star events with a history of sharp market swings. For Singapore-based traders, start with GDP releases to gauge the health of the country’s export-driven economy. Test how markets respond to central bank decisions (FOMC, ECB, BoJ and RBA), US Non-Farm Payrolls and CPI data, which often trigger large currency movements.
Track MAS policy updates and Singapore’s monthly CPI figures to assess regional risk conditions. Get accurate data from official sources such as SingStat or MTI.
How much data do I need for a reliable backtest?
Use historical data to set baseline metrics, such as the Sharpe ratio and maximum drawdown. A standard backtest alone doesn’t account for extreme market outcomes.
To estimate these outcomes more reliably, run Monte Carlo simulations with 50,000 to 200,000 randomised paths. These can show potential drawdowns that a single historical path might miss, helping you assess how well the strategy holds up before deploying it in live trading.
How do I handle conflicting US and Singapore signals?
Prioritise price action. Use macroeconomic data to manage risk, not to rule out trades. If the price trend goes against your data-based view, cancel or adjust pending orders.
Cut exposure when signals conflict or growth forecasts fall. Stay out during excessive volatility or conflicting news, and wait for technical confirmation before taking on more risk.
Use rule-based filters to tighten stop-losses or cut exposure when indicators diverge. Keep an eye on bond-market reactions and yields.