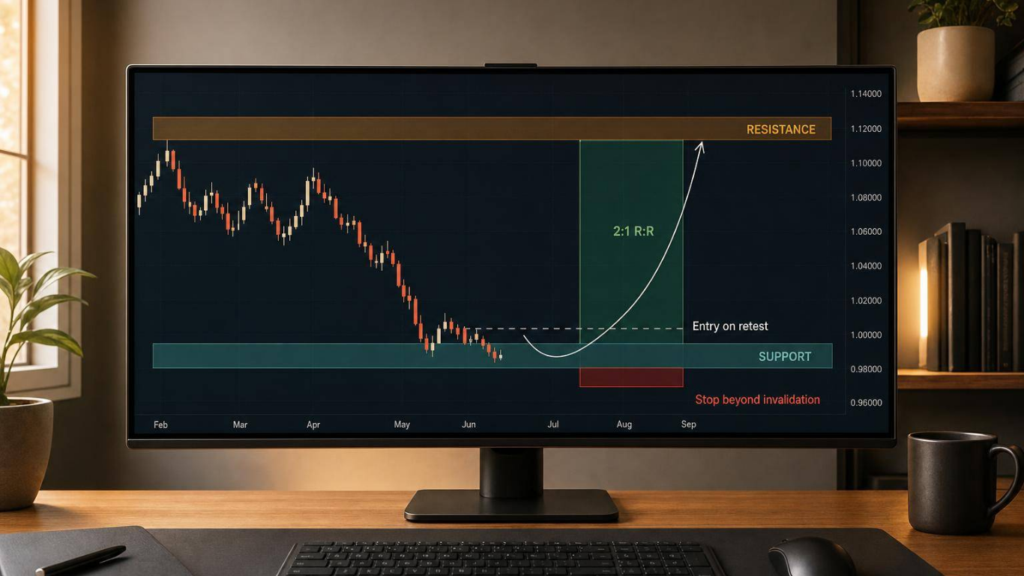
If I had to boil this down to one rule, it’s this: I plan the trade before price gets to the level. That means I mark the zone, pick the entry type, set the stop just beyond invalidation, and check that the trade still offers at least 1:2 reward-to-risk.
Here’s the short version:
- Support and resistance are zones, not single lines
- I start with the weekly chart, refine on the daily, then tighten on the 4-hour or 1-hour
- I only pay attention to levels with clean reactions, repeat touches, or overlap with things like round numbers and the 50-day/200-day SMA
- I use 3 entry types: bounce, breakout, and breakout-retest
- I wait for candle closes, instead of reacting to wicks
- I place my stop-loss beyond the zone or swing point
- I set my profit target at the next price barrier
- If the setup does not offer at least 2:1 reward-to-risk, I pass
- If price has already run too far, I do not chase it
A simple example from the article makes the point fast. If I buy at S$3.00 and place a stop at S$2.88, I risk S$0.12 per share. If I move that stop to S$2.83, my risk becomes S$0.17 per share. On a max risk of S$300, position size changes from about 2,500 shares to about 1,760 shares. Same idea. Different risk.
sbb-itb-466c9b0
Quick Comparison
| Setup | What I wait for | Where I enter | Where I place the stop | Main risk |
|---|---|---|---|---|
| Bounce | Rejection at support/resistance | After the rejection candle closes | Beyond the zone or recent swing | False bounce |
| Breakout | Full candle close beyond the zone | After the break, if not overextended | Back inside/beyond the broken area | Chasing a large breakout candle |
| Breakout-retest | Break first, then retest that holds | On confirmation during the retest | Beyond the retest low/high or zone | Retest fails |
My takeaway: support and resistance only help if I use them with rules. A marked zone, a clear trigger, a fixed stop, and a target at the next barrier turn a random idea into a planned trade.
How to Mark Good Support and Resistance Levels
Use the zones from the previous section as your map. Then tighten them up with a simple top-down process.
Start With Higher Timeframes, Then Refine the Zone
Begin with the weekly chart and mark the obvious swing highs and lows. That gives you the big picture first, instead of getting lost in small price moves.
Next, move to the daily chart and refine those weekly zones. Draw rectangles around price areas where the market reacted more than once. Also mark consolidation ranges that acted as the base before a move higher or lower.
After that, drop to the 4-hour or 1-hour chart and tighten the zone around the clearest reaction points. This can include:
- The previous day’s high and low
- Gaps
- Well-defined intraday ranges
If a level only makes sense when you’re heavily zoomed in, leave it out. It probably won’t matter much in your trading plan. Label each level as weekly, daily, or intraday so you can sort them properly when planning entries, stops, and targets.
How to Judge Level Quality Using Touches, Reactions, and Confluence
Not all levels deserve the same attention. A zone with two or three clean reactions usually has more weight than one with only a single touch. But don’t count every tap. Focus on sharp rejections like pin bars, hammers, or shooting stars with long wicks. Small candles with no follow-through usually aren’t worth much.
What turns a decent level into one you should pay close attention to? Confluence.
When a horizontal zone lines up with other indicators, it tends to matter more. That might be:
- A trendline
- A widely watched moving average such as the 50-day or 200-day SMA
- A session reference like the previous day’s high or low
- A round number
Round numbers often attract clusters of orders, so they’re worth marking. And if zones from several timeframes overlap, combine them into a single area instead of filling your chart with extra lines.
Once your zones are marked, wait for price to come to them. Then look for a bounce, breakout, or retest setup.
How to Plan Entries at the Level Instead of Chasing Price
Once you’ve marked the zone, decide how you’ll enter before price gets there. That matters more than most traders think.
If price runs too far from the level, your reward-to-risk starts to shrink. Your stop still needs to sit beyond the zone, but the room to your target gets smaller. That’s why it often makes more sense to wait for a pullback or retest instead of jumping in late.
Bounce, Breakout, and Breakout-Retest Entries Explained
Each entry type suits a different market condition, and each one needs its own trigger, which you can learn to master through a trading course.
A bounce entry happens when price moves into a marked support or resistance zone and then shows clear rejection. At support, that could be a hammer, pin bar, or bullish engulfing candle. At resistance, it could be a shooting star or bearish engulfing candle. Let the rejection candle close first. Then enter at the open of the next candle. Put the stop-loss beyond the zone or the recent swing point, and aim for the next logical barrier on the chart.
A breakout entry comes when price closes with intent beyond support or resistance. The key detail is simple: the candle must close beyond the zone, not just poke through it with a wick. If the breakout candle is too large, don’t chase it. Stand aside and wait for a retest.
A breakout-retest entry is a bit more patient. Price breaks the level, then you mark that same zone as new support or resistance and wait for price to come back to it. You only enter if the retest holds and the lower timeframe backs up the move. That confirmation might be a rejection candle or a tight consolidation above the level. In many cases, this gives you a calmer entry and a tighter stop than buying or selling the first breakout candle. Once the trade is set, place the stop beyond invalidation and set the target at the next barrier.
How to Use Confirmation and Multiple Timeframes
A simple way to do this is to mark the zone on the higher timeframe, then drop to a lower timeframe for the trigger.
For breakout-retest setups, wait for the higher timeframe to print a clean close beyond resistance. Then treat that broken zone as new support. After that, watch the lower timeframe for price to revisit the area. A bullish engulfing candle or a tight consolidation that stays above the level can act as confirmation.
This two-step approach helps you stay grounded. The higher timeframe gives context. The lower timeframe gives timing.
Rules to Avoid Late Entries After a Big Move
Chasing breakouts is one of the most persistent and costly mistakes in retail trading. It feels tempting in the moment, especially when a chart looks like it’s about to run away. But once price has already stretched too far from the zone, the trade often gets worse. Your stop still belongs beyond the level, while your upside gets squeezed.
A few simple rules can help:
- If price has already extended well past the zone, skip the trade and wait for a retest.
- Require at least a 2:1 reward-to-risk based on the next logical target. If the setup doesn’t meet that test, pass.
How to Set Stop-Losses and Profit Targets With Clear Rules
After you pick your entry, set the stop and target before you place the trade. Keep the order simple: level → entry → invalidation → target.
That matters because once the trade is live, emotions can creep in. A clear plan helps you act on structure, not impulse.
Where to Place Your Stop-Loss: Beyond the Zone or Swing Point
Your stop should sit beyond the invalidation point. For long trades, that means below the support zone. For short trades, above the resistance zone. Put it just past the zone, with only a small buffer for normal volatility.
You have three main structural choices:
- Beyond the zone itself: tighter stop, tied closely to the level
- Beyond the nearest swing point: gives the trade more room, but you’ll need a smaller position size
- Based on ATR(14): adjusts to current volatility, though it may not line up neatly with the zone
Here’s a simple example. Say you buy at S$3.00, with support at S$2.90 and a swing low at S$2.85. A zone-based stop at S$2.88 means you’re risking S$0.12 per share. A swing-based stop at S$2.83 means the risk goes up to S$0.17 per share.
If your max risk on the trade is S$300, the maths changes straight away. The zone stop lets you take about 2,500 shares, while the swing stop cuts that to about 1,760 shares. Neither choice is wrong. It comes down to how much space the trade needs to breathe.
Once invalidation is fixed, your target should come from the chart’s next barrier – not from hope.
How to Target the Next Logical Price Barrier
Set the target at the next resistance zone. If price is moving inside a range, aim for the other side of that range. If there’s a stronger level just beyond your first target on the daily or weekly chart, that can serve as your stretch target.
Work out the reward-to-risk ratio before entry. A common rule is at least 1:2, which means the possible gain is at least twice the amount you’re risking. Change the stop, and the ratio changes too. So do the calculation before you commit.
For partial exits, take some profit at the first major level, then leave the rest for the next barrier.
Use the checklist below to confirm the level, stop, and target before entry.
Master Systematic Trading with Collin Seow
Learn proven trading strategies, improve your market timing, and achieve financial success with our expert-led courses and resources.
A Repeatable Support and Resistance Trade Checklist
Use this checklist only after the zone, entry, stop, and target are already mapped out. Go through it step by step. If one item fails, you skip the trade. Simple as that.
Key Points to Check Before Placing Any Trade
| Step | What to Check | Rule |
|---|---|---|
| 1. Confirm the zone is already marked | Is the level a zone, not a single line? | Must be confirmed before moving to the next step |
| 2. Timeframe alignment | Does the higher timeframe support the setup direction? | Trade only when the higher-timeframe trend and level align |
| 3. Setup type | Is this a bounce, breakout, or breakout–retest? | Decide before entry – each has different stop and target rules |
| 4. Entry trigger | Is there a clear signal (pin bar, engulfing candle, break of swing high/low)? | No trigger, no trade. |
| 5. Stop-loss | Is the stop placed beyond the zone or swing point? | Must be defined before the order goes in |
| 6. Profit target | Does the next barrier offer at least 1:2 reward-to-risk? | Skip the trade if reward-to-risk falls below 1:2 |
| 7. Extension check | Has price already moved too far from the zone? | If yes, skip the trade. |
This works like a filter. You’re not trying to force a setup. You’re checking whether the setup still makes sense right now. This disciplined approach is a core pillar of systematic trading.
A few parts matter more than people think:
- The zone comes first. If you’re trading off a thin line instead of an area, your stop and entry can get messy fast.
- Higher timeframe direction matters. A clean setup on a lower timeframe can still fail if it’s pushing against the bigger move.
- The trigger is non-negotiable. No signal means no entry, even if the level looks good.
- The 1:2 reward-to-risk rule keeps you honest. If the next barrier is too close, the trade doesn’t give you enough room.
If price has already stretched too far away from the zone, stand aside. Chasing late entries is where a lot of bad trades begin.
FAQs
How wide should a support or resistance zone be?
Support and resistance are usually better treated as zones, not exact lines. Why? Because they point to areas where price may turn, not a single perfect level.
There’s also no fixed width for these zones. That’s why many traders use ATR to match the zone to current volatility.
For example, a breakout may be treated as meaningful if price moves above resistance by 1.0x ATR. Stop-losses are often set 1% to 2% below support, or placed further away when volatility is higher.
When should I use a zone stop instead of a swing-point stop?
Use a zone stop when you want to give price some room to move around support or resistance, instead of exiting at one exact level.
A swing-point stop is tighter. It sits at a specific high or low. A zone stop adds a buffer. That extra room can help you avoid getting stopped out by normal volatility or market noise when price briefly pushes past the level, then turns back.
How do I know if a breakout is overextended?
A breakout can be overextended or unreliable when it happens on low volume, or when volume is falling. That often points to a possible fakeout.
It also helps to watch ADX and RSI.
- A falling ADX can mean trend momentum is weakening.
- Bearish RSI divergence happens when price makes a new high but RSI makes a lower high. That can be a sign the move is losing strength.