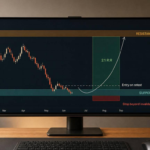
Earnings announcements can cause big swings in options prices. Here’s what you need to know:
- Earnings surprises occur when a company’s results differ from analysts’ expectations. For example, Alphabet beat EPS estimates in Q4 2023 but still saw a 5% stock drop due to weaker ad revenue.
- Implied volatility (IV) rises before earnings due to uncertainty and drops sharply after results are announced. This is called the “volatility crush.”
- Volatility crush can reduce IV by 20–60% overnight, impacting options premiums regardless of stock price movement.
- Key risks include losing money on long options despite correct predictions due to IV drops. Sectors like biotech see the largest IV changes, while utilities see smaller shifts.
- Strategies like iron condors, vertical spreads, and calendar spreads can help manage risks. Timing is critical – enter 1–2 days before earnings and exit shortly after.
In short, earnings season offers opportunities but requires careful planning and risk management to navigate the volatility.
How Earnings Surprises Affect Options Volatility
Why Implied Volatility Rises Before Earnings
In the lead-up to an earnings announcement, options premiums tend to climb. This happens because market makers factor in the uncertainty surrounding the company’s results – whether they’ll beat expectations, miss them, or deliver unexpected guidance. Beyond this uncertainty, there’s also a time-based effect at play. As the earnings date approaches, the event variance is spread over fewer days, which amplifies the annualised implied volatility (IV). This creates the illusion of a steep IV increase, even though the option’s intrinsic value remains unchanged. Adam from TradingRiot explains it well:
“The ‘IV ramp’ heading into earnings is not free money for straddle buyers. The rise in annualized IV is largely mechanical.”
This pre-earnings IV build-up sets the stage for what comes next: the sharp adjustment known as the volatility crush.
The Volatility Crush After Earnings
After the earnings report is released, the uncertainty vanishes, and IV drops rapidly. This collapse, often referred to as the volatility crush, typically happens within the first 15–30 minutes of trading after the announcement. The drop can be dramatic.
For holders of long options, this is where the vega effect becomes a real concern. For example, a call option with a vega of 0.30 that experiences a 15-point IV drop would lose S$4.50 in value purely due to the volatility change. This loss can easily outweigh any gains from a correct directional move. As Tomasz Dobrowolski of FlashAlpha puts it:
“IV crush means you can be right on direction and still lose money on a long options position.”
The extent of the volatility crush varies significantly by sector. Biotech stocks, where a single FDA decision can make or break outcomes, experience the steepest drops. Conversely, utilities, with their steady and predictable earnings, see much smaller changes.
| Sector | Typical IV Drop | Examples |
|---|---|---|
| Biotech | 40–70% | MRNA, BIIB, REGN |
| High-beta tech | 35–55% | TSLA, NVDA, NFLX |
| Mega-cap tech | 30–50% | AAPL, MSFT, AMZN |
| Financials | 20–35% | JPM, GS, BAC |
| Consumer staples | 15–30% | COST, WMT, PG |
| Utilities | 15–25% | NEE, DUK, SO |
(Source: FlashAlpha)
How Surprise Size and Direction Drive Volatility
Earnings surprises affect volatility based on how they compare to the implied move – the market’s pre-earnings forecast. This implied move is typically around 85% of the at-the-money straddle price.
Historically, stock movements stay within the implied range about 60–65% of the time. If the actual move falls short of expectations, the IV crush is more pronounced. On the other hand, if the surprise exceeds the implied move, IV may remain elevated or even increase in the weeks that follow. As Cai Zhu from Hong Kong University of Science & Technology notes:
“Larger earning surprise magnitude, no matter the news itself is good or bad, will lead to increasing implied volatility in following months.”
Real-world examples from October 2023 highlight this dynamic. Apple reported a revenue decline but beat EPS estimates, and the stock moved just S$3 against an implied move of S$8. Traders who sold straddles profited as the actual move was smaller than expected. Amazon, however, reported better-than-expected AWS growth, with the stock closing up S$8.50 despite an implied move of only S$6 – call buyers benefited even after the volatility crush. Earlier in January 2023, Tesla shocked the market with unexpected price cuts and guidance, driving the stock down S$22 against an implied move of S$12. This larger-than-expected move caused losses for volatility sellers.
The size of the surprise, rather than whether the news is good or bad, is often the key factor in determining post-earnings volatility behaviour. This underscores the importance of carefully managing risk and selecting the right stock picks when trading around earnings events.
Risk Management Strategies Around Earnings Volatility
When it comes to earnings season, the predictable IV (implied volatility) crush after announcements makes disciplined risk management essential. Below, we explore strategies to navigate the sharp volatility shifts during this period.
Using Defined-Risk Options Strategies
Understanding volatility patterns around earnings is only half the battle; the next step is to structure trades that keep your losses manageable. The key here is simple: ensure every trade has a defined risk.
One popular approach is using iron condors. This strategy involves selling an out-of-the-money call spread and an out-of-the-money put spread simultaneously. The goal? Collect premiums while capping your potential losses. This setup works best when you expect the stock to stay within its implied move range – something that happens roughly 60–65% of the time.
For traders who have a directional bias, vertical spreads (bull call or bear put spreads) are a great choice. They allow you to bet on a stock’s movement while limiting your downside to the net debit paid. If you’re targeting the IV crush, calendar spreads can be especially effective. By selling a front-month option (set to expire just after earnings) and buying a longer-dated option at the same strike, you can capitalise on the faster IV drop in the front-month option compared to the back-month.
Regardless of the strategy, position sizing is critical. Earnings gaps can sometimes exceed stop-loss limits, so it’s wise to reduce your position sizes by 30–50% using fixed ratio or fractional sizing during earnings periods.
Timing also plays a crucial role in executing these strategies effectively.
When to Enter and Exit Trades Around Earnings
Timing is a make-or-break factor for earnings trades. For volatility-selling strategies, the sweet spot to enter is typically one to two days before the earnings announcement, when IV is at its peak. Entering too early might cause you to miss the final IV spike, while waiting until the day of the announcement leaves little room for adjustments.
When it comes to exiting, a practical rule is to close or trim positions at least 10 minutes before the market closes on the day of the announcement. If you decide to hold a portion of your position through the event, you can use the “keep fraction” formula to determine how much to retain:
Keep fraction ≈ Profit cushion per share ÷ Expected move in dollars
Itai Levitan from InvestingLive puts it succinctly:
“Risk mitigation into earnings is not about predicting the print. It is about answering one professional question: ‘How much do I want to keep on… so an adverse gap does not ruin my week?'”
Common Mistakes to Avoid During Earnings Season
Even with solid strategies, avoiding common errors is key to preserving your capital.
One frequent mistake is buying long calls or puts solely based on directional conviction without considering the IV crush. A 20–60% drop in IV in a single session can wipe out gains even if you correctly predict the stock’s direction.
Another pitfall is over-concentration – placing too much capital on a single earnings event. Diversifying across sectors can help reduce risk. For example, balancing a high-volatility tech position with a steadier consumer staples trade can smooth out potential losses.
Traders should also be cautious of the “whisper miss” risk. Sometimes, a company beats earnings expectations on paper, but the stock still underperforms because the results don’t align with the market’s broader expectations.
Collin Seow, founder of Collin Seow Trading Academy, captures this idea perfectly:
“Success in trading is not just about making decisions; it’s about making informed decisions.”
Master Systematic Trading with Collin Seow
Learn proven trading strategies, improve your market timing, and achieve financial success with our expert-led courses and resources.
Assessing the Market’s Reaction After Earnings
After an earnings announcement, the initial after-hours price movements often don’t tell the whole story. A deeper analysis is needed to decide whether the market’s reaction aligns with the actual fundamentals. This post-earnings evaluation can help refine future trading strategies by identifying patterns in how the market responds.
Comparing Actual vs. Implied Price Moves
One of the best ways to assess the market’s reaction is by comparing the actual price move with the implied move that options priced in before the announcement. To calculate the implied move, multiply the at-the-money (ATM) straddle price for the relevant weekly expiration by 0.85. This gives you the market’s 1-standard-deviation expectation.
Next, compare this implied move with the stock’s actual performance. Research indicates that implied volatility tends to overestimate the actual post-earnings move by around 15% to 20%, and the stock’s movement stays within the implied range about 60% to 75% of the time for large-cap stocks. When the actual price change exceeds the implied range, it’s often a sign of a genuine fundamental surprise – something the market hadn’t anticipated.
For instance, in January 2026, Meta Platforms (META) initially surged by +8.5% in after-hours trading after its earnings release. However, by the close of the next trading day on 29 January 2026, the stock had dropped to US$668.73, below its pre-earnings close of US$672.97. This suggests the initial spike was an overreaction. On the same night, Microsoft (MSFT) fell -5.1% after hours but recovered almost entirely by the next day’s close, ending at US$481.63 compared to its pre-earnings close of US$480.58. These examples highlight why it’s important to look beyond the after-hours gap and consider the next day’s closing price for a clearer picture.
After comparing price moves, it’s also helpful to track how implied volatility reacts to the announcement.
Tracking Volatility After Earnings
Once the implied volatility (IV) crush occurs, monitor whether IV returns to its historical baseline or remains elevated. If IV stays high even after the announcement, it could indicate lingering uncertainty – possibly related to unclear forward guidance or broader industry concerns.
Take Palantir (PLTR) in May 2026 as an example. Before its 4 May earnings report, its IV climbed to nearly 90%. Despite delivering strong growth numbers and raising guidance, the IV rank dropped sharply into the low 20s within just a few days. This is a textbook example of an IV crush, even in the context of positive news. As mentioned earlier, typical IV drops range from 15–25% for utilities to 40–70% for biotech stocks, which can serve as a benchmark for how quickly volatility normalises across different sectors.
These observations on volatility provide valuable clues for adjusting your trading strategies.
Using Post-Earnings Analysis to Improve Future Trades
Keep a detailed trading log that tracks the implied move, actual move, IV normalisation, and subsequent price action. Over several quarters, patterns will start to emerge. Some stocks may consistently overprice volatility, making them ideal for premium-selling strategies. Others might frequently exceed their implied range, favouring long options setups.
Additionally, it’s worth considering Post-Earnings Announcement Drift (PEAD). As Adam, Founder of TRADINGRIOT, explains:
“Post-Earnings Announcement Drift (PEAD) is one of the most robust findings in finance. Stocks that gap on earnings tend to continue drifting in the same direction, not reverse.”
If a stock gaps up and holds its gains with strong trading volume, there’s a good chance the drift will continue for days or even weeks. This can be a key factor in planning your next trade. On the other hand, a sharp gap that’s reversed by the next day’s close – like META in January 2026 – often signals that the initial move was driven more by sentiment than by fundamentals. By tracking these patterns over time, you’ll get better at distinguishing between noise and meaningful signals. That ability is what turns reactive trading into informed decision-making.
Conclusion: Key Takeaways for Traders
Earnings season stands out as one of the most unpredictable yet opportunity-filled times in options trading. The gap between what the market anticipates and what actually happens creates a unique mix of risks and rewards. One key insight? Implied volatility (IV) often overshoots actual post-earnings price moves by around 15–20%, making the “IV crush” a recurring and exploitable phenomenon. As professional options trader Andy Crowder explains:
“The IV crush doesn’t care whether the stock goes up or down. It cares that uncertainty resolved. Sell the uncertainty before it resolves, and let the crush do the work.”
Navigating this volatility takes more than guessing price direction. It demands a structured strategy. Defined-risk approaches like iron condors, careful position sizing (keeping trades to 1–2% of your capital), entering trades 1–3 days before earnings, and exiting the morning after earnings are all key steps. Additionally, tracking implied versus actual price moves and observing how IV normalises post-earnings can help you identify patterns over time, improving future trade decisions.
It’s also important to remember that even if your directional bet is correct, the IV crush can still erode your profits. That’s why the way you structure your trade is just as important as your market outlook.
For traders in Singapore, these strategies are particularly useful during the main earnings cycles in January, April, July, and October. These periods offer consistent opportunities to apply systematic methods. The key is repetition and discipline. By understanding the IV crush and using sound risk management rules, traders can improve their performance during these volatile times. If you’re looking to build a strong, rule-based trading foundation, the Collin Seow Trading Academy offers free e-courses and live webinars to help you get started.
As Collin Seow, founder of the academy, puts it: “Success in trading is not just about making decisions; it’s about making informed decisions.”
FAQs
How do I estimate a stock’s implied move before earnings?
To estimate a stock’s expected movement before an earnings report, you can calculate the at-the-money (ATM) straddle price for the options expiring immediately after the event. Here’s how:
- Combine the mid-prices of one call and one put option at the strike price closest to the stock’s current price.
Then, use this formula:
Expected Move (%) = (ATM Straddle Price / Current Stock Price) × 100
This calculation reflects the market’s anticipated price swing. Some traders refine this by applying a multiplier, such as 67%, to account for variability in actual outcomes.
Why can I lose money on long calls or puts even if I’m right on direction?
You can end up losing money on long calls or puts even if you correctly predict the stock’s direction, and the culprit is often volatility crush. Here’s how it works: Before earnings announcements, there’s a lot of uncertainty, which pushes up implied volatility (IV) and, in turn, option premiums. But once the earnings are out, that uncertainty disappears, and IV typically drops sharply – often by 30%-60%. This drop slashes the option’s extrinsic value, and in some cases, the loss from this decline can outweigh any profit from the stock’s price movement, leaving you with a net loss.
Which options strategy is best for earnings: iron condor, vertical spread, or calendar spread?
The best approach hinges on your comfort with risk and how you see the market moving:
- Iron condors: Great for limiting risk when you think a stock will stay within a specific price range.
- Vertical spreads: Perfect if you have a directional view and want to take advantage of the drop in volatility after earnings.
- Calendar spreads: Useful for capitalising on differences in implied volatility without needing to predict price movement.
Collin Seow Trading Academy provides tools and guidance to help you learn these strategies step by step.