
The feeble recovery in November raises an element of doubt that the spot gold’s consolidation that began in October may not be over just yet.
The yellow metal rebounded earlier this month from quite strong support at the end-of-October low of 3885, as highlighted in the previous update “Gold: Downside Could Be Limited” early November. However, the subsequent recovery hasn’t demonstrated the upward momentum like in earlier months.
Momentum Check: RSI Signals Point to Ongoing Consolidation
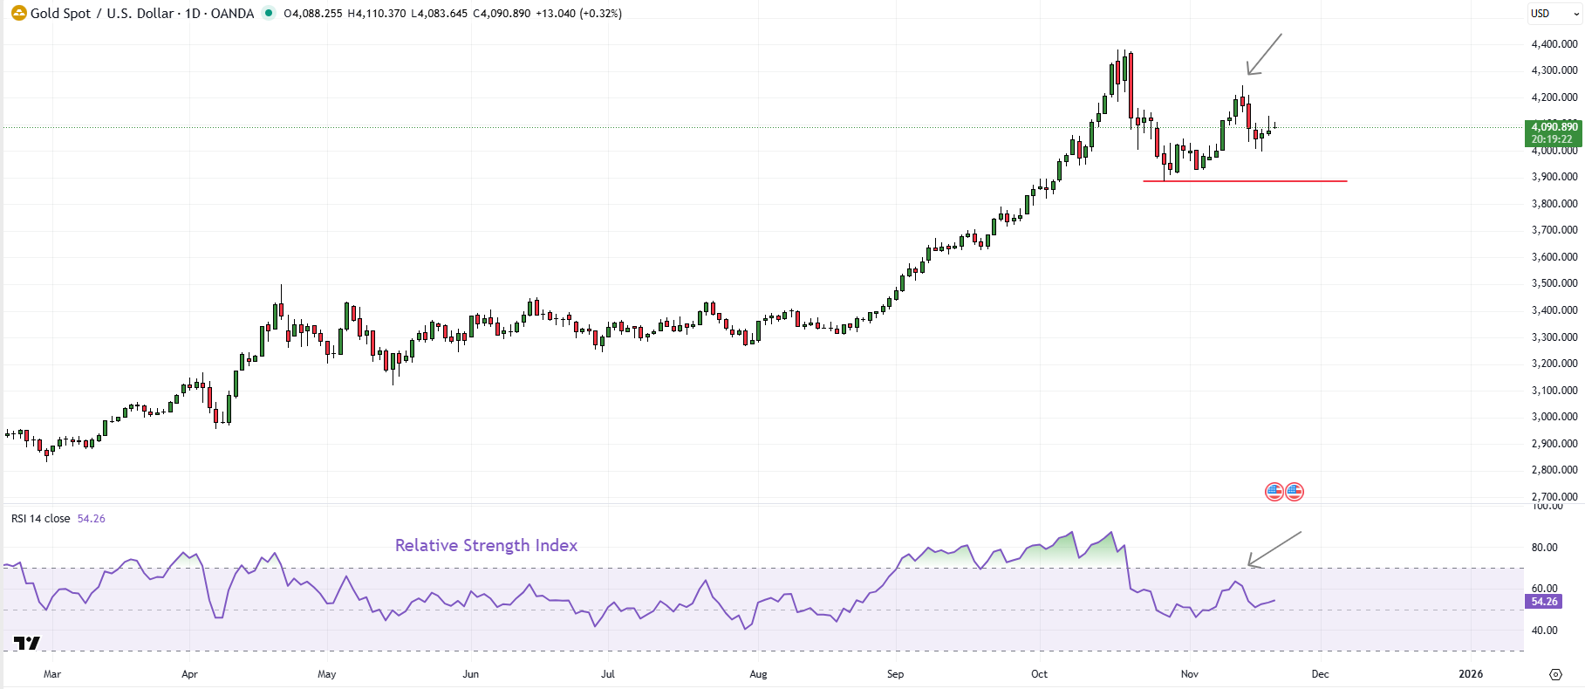
The 14-day Relative Strength Index (RSI) barely moved above 60 even as spot gold came close to its record high of 4380 hit in October.
The rising price, associated with weak momentum, is a sign that the rebound this month is part of the unwinding process that began last month, and that the consolidation/correction may have further to run in the short term.
Spot Gold (XAUUSD; Daily):
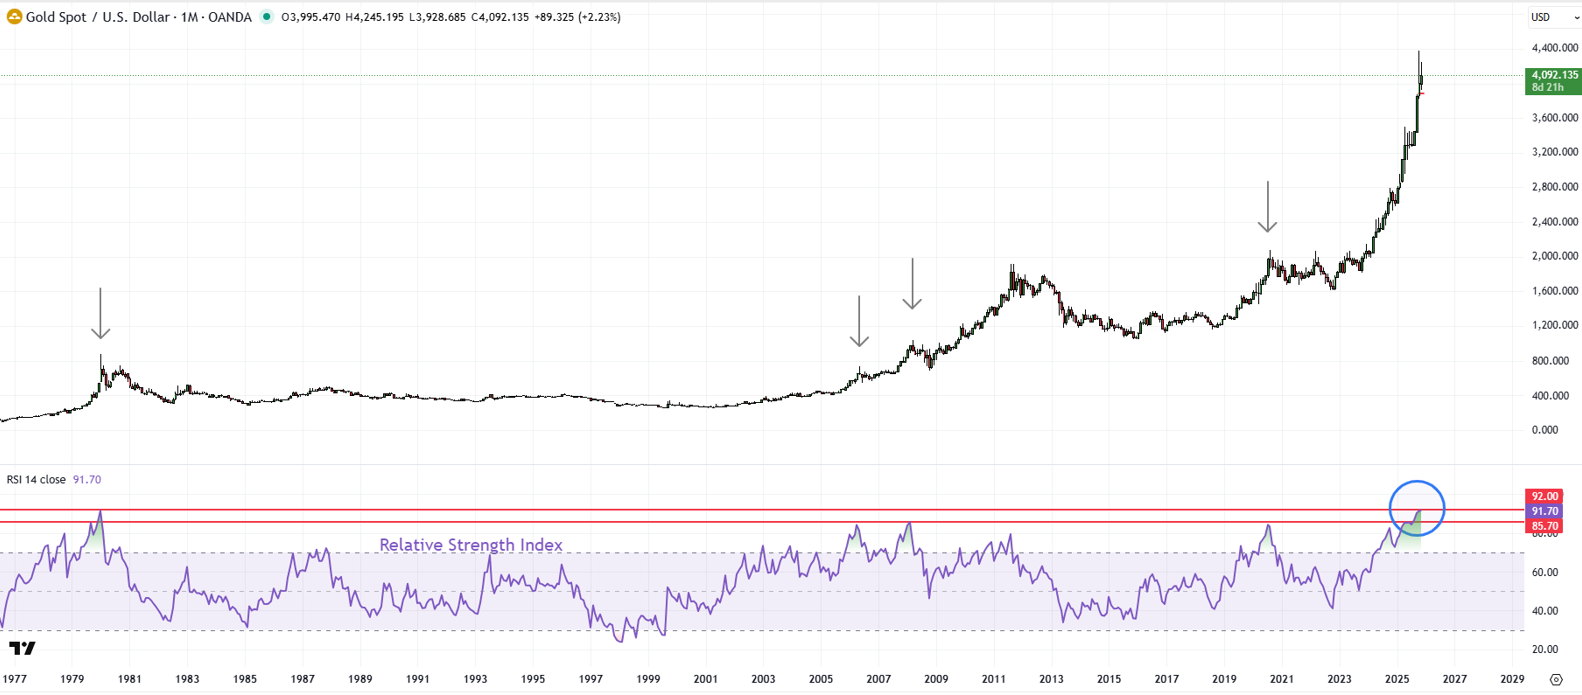
Overstretch Alert on the Monthly Chart (RSI > 90)
The possibility for an extended consolidation is further highlighted by RSI on the monthly chart, which rose above 90 in October. RSI levels above 70 are generally considered overbought, but RSI levels above 90 are often warning signs of an overstretched market, as pointed out in the previous update.
The primary trigger for a potential longer-duration consolidation appears to be the outlook on US monetary policy after the October Federal Reserve Open Market Committee (FOMC) meeting cast doubt on the December rate cut.
Federal Reserve Chair Jerome Powell cautioned against assuming that a December interest rate cut was a foregone conclusion, prompting odds of a December Fed rate cut to shrink to less than 40% from over 90% before the October FOMC meeting, according to CME’s FedWatch tool.
Spot Gold (XAUUSD; Weekly)
Fed Minutes: Lower High Forms as Rebound Fades
Minutes of the Fed meeting released on November 19 showed members are deeply divided on the need for another rate cut this year, suggesting that a December rate cut is not a done deal. The minutes put a lid on the rebound in precious metals, and in the process created a lower high (relative to the October high) for the first time since July/August.
Until there is more clarity on the path of monetary policy, which is unlikely to be until the December 9-10 FOMC meeting, the balance of risks seems tilted sideways/down for gold. Lower interest rates reduce the opportunity cost of holding the non-yielding yellow metal, thereby boosting gold prices.
Spot Gold (XAUUSD; Daily):

On technical charts, spot gold has immediate support at the end-of-October low of 3885. Any break lower could open the way toward strong support on the 100-day moving average (now at about 3685) – hasn’t broken below the average since 2023. Subsequent support comes in at the April high of 3500.
Looking beyond the near term, consistent buying by central banks and concerns regarding US debt levels are likely to limit the downside in gold prices. Worries regarding US budget deficits have prompted investors to look at alternative safe-haven assets compared to US Treasuries.
FAQ
Is gold’s consolidation over?
Not yet. November’s rebound lacked momentum (14-day RSI barely above 60) even as price neared the October record high, hinting the consolidation may continue.
How is the Fed influencing gold near term?
Powell cautioned against assuming a December cut, and the odds fell to below 40% from over 90% pre-FOMC, damping the rebound in precious metals.
What price levels should traders watch?
Support sits at 3,885; a break opens the 100-day moving average near 3,685, with subsequent support around 3,500.
What could limit downside despite near-term risks?
Ongoing central-bank buying and concerns about US debt provide a fundamental floor for gold demand.