Disclaimer
All articles are for education purposes only, and not to be taken as advice to buy/sell. Please do your own due diligence before committing to any trade or investments.
INTEL: Oversold but no respite yet.
Intel fell sharply last week after the company earnings missed analysts’ estimates. CEO Lip-Bu Tan plans to energize the troubled chipmaker by focusing on core engineering and slashing jobs failed to impress investors. Analysts had hoped for some more specifics from the CEO in terms of how he plans to restore the company’s leadership in manufacturing and a strategy to attract more external customers.
Intel has been nearly flat so far this year, outperforming Nvidia and Advanced Micro Devices. Whether it is able to maintain the outperformance remains to be seen given it is perceived to be lagging in artificial intelligence. Moreover, the stock is expensive (higher forward price-to-earnings ratio) relative to its peers. The company’s weak outlook against the backdrop of US-China trade war prompted analysts to cut the company’s price target.
Technical Analysis on Intel Corporation (NASDAQ: INTC)
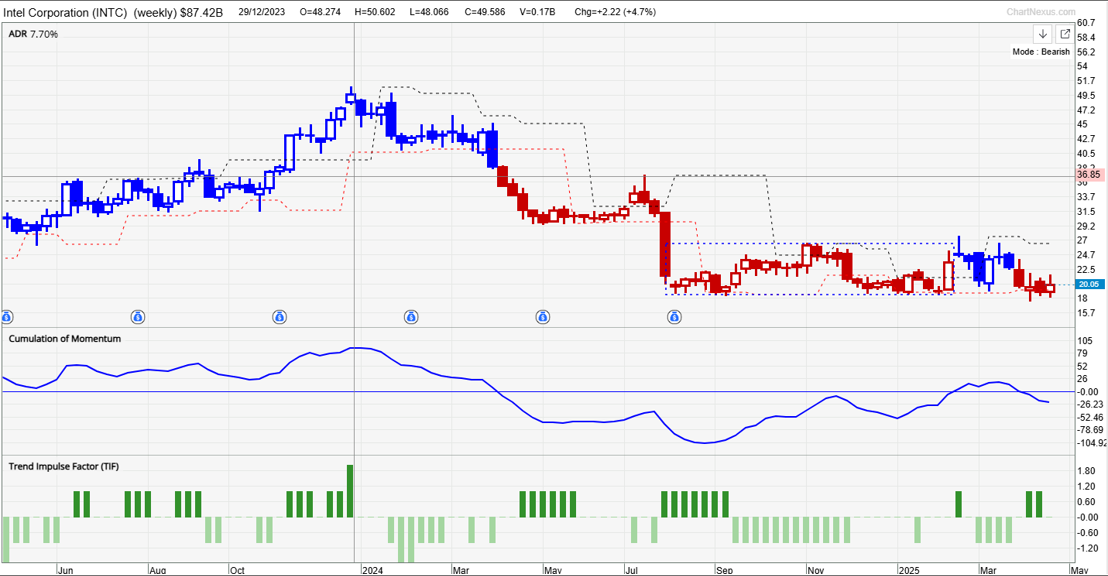
As the weekly chart above shows Intel has been in a downtrend since the end of 2023. However, what is noteworthy is our proprietary system TradersGPS (TGPS) gave a trend change signal soon after the stock made a high in December 2023 – a change in the colour of the candles is a signal for trend change. As per our system, Blue candles indicate the stock’s trend is up, while Red candles indicate the stock’s trend is down. On the weekly candlestick charts, since Q1-2024 the colour of the candles has been largely Red.
The big fall on April 25 came about as the colour of the candle was still Red. While the bearish trend is intact, the stock has been holding above quite strong support around 18.50. Moreover, a positive momentum divergence on the monthly charts suggests the multi-month slide appears to be losing steam. So then is it time to buy now?
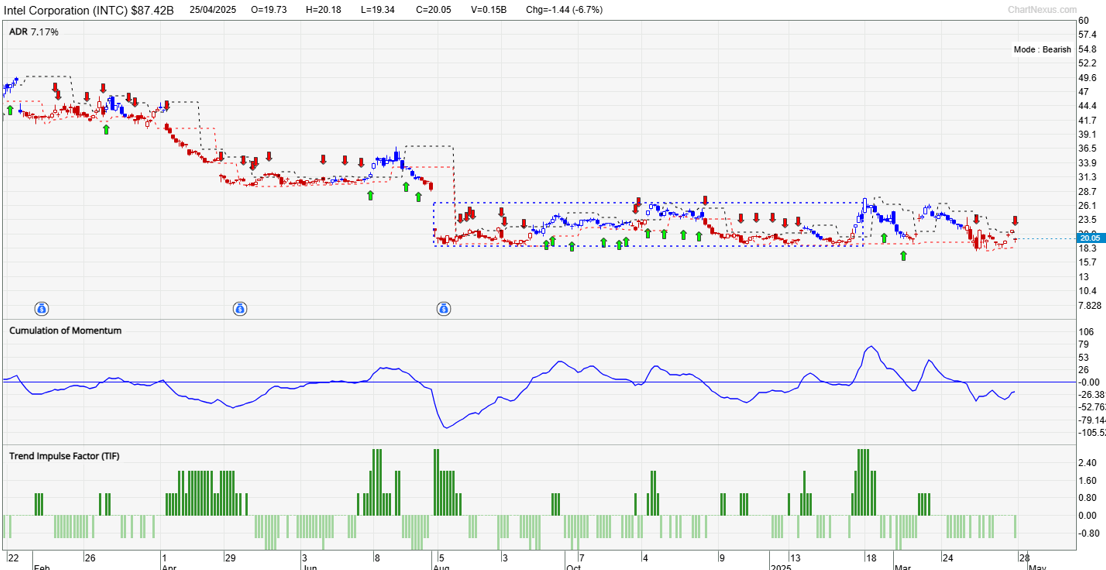
To answer that question, I would switch to a Daily chart or a shorter time frame as I am not sure about longer-term given some of the uncertainties pointed out earlier. At the same time, I wouldn’t want to miss out on a juicy trading opportunity. For this, I would go back to our proprietary system. There are two main proprietary indicators to enable me to decide if the timing is appropriate to buy the shares. The first indicator is the arrow. Green arrows are associated with Blue candles, signifying an uptrend is underway. Unfortunately, candle colour remains Red and there is no green arrow. The appearance of a green arrow would suggest that the risk:reward in longs is attractive.
In order to confirm if the ensuing trend is going to be lasting, I would look at the Trend Impulse Factor (TIF) indicator. When the colour of TIF bar is dark green, it is a sign that a bullish move is likely to be sustainable, and at such a time buying the shares would offer a good risk:reward.
Unfortunately, candle colour remains Red, and there is no green arrow with a TIF. That suggests I might need to wait a bit longer. The appearance of a green arrow would suggest that the risk:reward in longs is attractive.
TESLA: Is it time to look at the stock favourably?
Tesla jumped last week, staging one of the best weekly rallies since the stock’s downtrend began last year, thanks to less-worse than expected first quarter earnings, easing of some self-driving safety rules by the Trump administration, and signs of reducing US-China trade tensions.
Is this a sign that the stock has seen its worse? On the fundamental side, analysts remain divided with optimistics highlighting Tesla is better positioned on tariffs on its cars compared with its peers. On the other hand, still-rich valuation relative to its peers, and declining Tesla’s EV sales all over the world due to competition is keeping some analysts cautious.
It is at such times especially that a tried-and-tested trading system can come in very handy. It helps to de-clutter the available information and make a sound assessment. In fact, whether you are a trader or a long-term investor, trading stocks without a proper system can be highly risky. This is why the TradersGPS (TGPS) system was created. The indicators will help you determine if a stock is ready for action to be taken.
Technical Analysis on Tesla (NASDAQ: TSLA)
Tesla appears to have formed a temporary base around 218-220. A positive momentum divergence at the lows is sign that the 15-month slide is losing steam. Furthermore, the sideway pattern since March could be viewed as accumulation. Any break above immediate resistance at the March high of around 292 could point to further recovery.
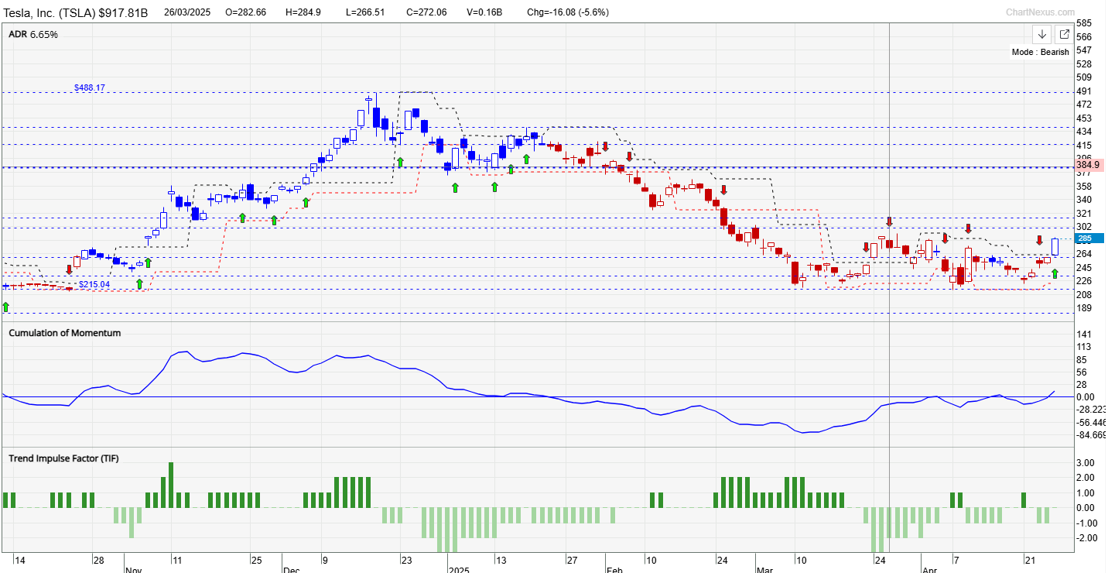
Tentative signs are beginning to emerge on the TradersGPS (TGPS) system. For the first time since January, a green arrow has appeared on the Daily charts of Tesla, raising the prospect of some stabilization given the recent sharp fall or even a minor rebound. In order to confirm if the ensuing trend is going to be sustainable, I would look at the Trend Impulse Factor (TIF) indicator. When the colour of TIF bar is dark green and it is associated with a green arrow, it is a sign that a bullish move is likely to be sustainable. Currently, the TIF is lacking.
But there is no reason for disappointment. Given that some of the above negatives could be priced in the stock, the easing in risk aversion could create some long opportunities. I’ll be on the look out for a green arrow with TIF!