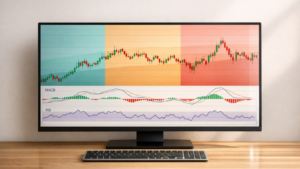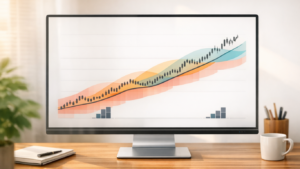
Sector-based stock screening helps you focus on specific industries like technology, healthcare, or finance, making it easier to identify trends, opportunities, and risks. It’s especially useful in Singapore, where sectors like finance, real estate, and technology drive the local economy. By narrowing your search, you can make smarter investment decisions, whether you’re looking to specialise in a sector or diversify within it.
Here’s what you’ll learn:
- Sector classification systems: GICS, ICB, and TRBC group companies into sectors and industries. For Singapore, ICB aligns best with SGX-listed stocks.
- Screening tools: Platforms like ChartMill, Koyfin, and EquityRT allow you to filter stocks by fundamental and technical metrics.
- Key filters: Use metrics like P/E ratios, dividend yields, moving averages, and trading volume to refine your stock picks.
- Practical tips: Save your screeners, adjust filters for Singapore’s market, and regularly update them based on market conditions.
Start by choosing a sector, setting up a screener, and applying filters to find stocks that fit your strategy. For Singapore-focused investors, this method offers a structured way to track local market trends and make informed decisions.
Understanding Sector Classification Systems
To refine your stock screening process, it’s essential to have a solid grasp of the major sector classification systems. These systems categorise companies based on their primary business activities, helping investors identify opportunities with greater precision.
Main Classification Systems: GICS, ICB, and TRBC
Three widely recognised classification systems – GICS, ICB, and TRBC – are commonly used by investors worldwide to group companies into sectors and industries.
- GICS: Developed by MSCI and Standard & Poor’s, this system divides the market into 11 sectors, 25 industry groups, 74 industries, and 163 sub-industries. Its structured hierarchy is especially popular with global indices like the S&P 500 and MSCI indices. This makes it an excellent tool for investors who want to start with broad sectors and drill down into niche industries.
- ICB: Maintained by FTSE Russell, ICB uses a slightly different structure with 11 industries, 20 supersectors, 45 sectors, and 173 subsectors. It is widely used in Europe and Asia, including on the Singapore Exchange (SGX), making it particularly relevant for Singapore-based investors. Its detailed breakdown ensures precise analysis for traders focusing on local markets.
- TRBC: Managed by Refinitiv, TRBC categorises companies into 10 sectors, 28 business sectors, 54 industry groups, 136 industries, and 837 activities. This system places a strong emphasis on economic activities, making it especially useful for thematic investing strategies targeting trends like renewable energy or emerging technologies.
Each system offers a unique way of classifying companies, which can impact your screening results. For instance, a technology company might fall under different classifications depending on the system you use.
Comparing the 3 Classification Systems
Understanding the differences between these systems can help you choose the one that aligns best with your investment strategy. Here’s a quick comparison:
| Feature | GICS | ICB | TRBC |
|---|---|---|---|
| Maintainer | MSCI & S&P Dow Jones | FTSE Russell | Refinitiv |
| Sectors | 11 | 11 | 10 |
| Industry Groups | 25 | 20 Supersectors | 28 Business Sectors |
| Industries | 74 | 45 Sectors | 54 Industry Groups |
| Sub-industries | 163 | 173 Subsectors | 136 Industries, 837 Activities |
| Regional Focus | Global, US-focused | Europe, Asia, SGX-aligned | Global, highly detailed |
| Used by | S&P, MSCI, global funds | FTSE, SGX, European funds | Refinitiv, thematic investors |
For Singapore traders, ICB is especially relevant as it aligns closely with SGX’s sector definitions, making it easier to compare local stocks. Globally, over 95% of equity funds rely on either GICS or ICB for sector allocation, giving these systems a significant edge in terms of accessibility and comparability.
On the other hand, TRBC stands out for its granular classifications, with 837 activity categories. This makes it a go-to option for investors interested in specific themes like artificial intelligence or sustainable energy, where detailed insights are crucial.
Which System to Use for Your Screening
Choosing the right system depends on your investment goals and the markets you’re focusing on. Here’s a breakdown of when to use each:
- For Singapore-focused screening: ICB is the most practical choice. Since SGX uses ICB classifications, this system ensures accurate alignment with local market data, making it ideal for analysing Singapore-listed companies.
- For global comparisons: GICS is your best bet. Its widespread adoption across major international indices makes it easier to benchmark Singapore stocks against their global counterparts.
- For thematic investing: TRBC offers unmatched detail, making it perfect for identifying companies involved in specific trends like fintech, biotechnology, or green energy.
Another important consideration is the compatibility of your screening platform. Most platforms support GICS and ICB, but TRBC availability may vary. Before committing to a system, check if your preferred platform provides comprehensive data for it.
Many experienced traders use multiple systems to suit different strategies. For example, you might rely on ICB for local stock analysis, GICS for international comparisons, and TRBC for thematic research. Whichever system you choose, consistency is key. Sticking to a single system for a specific strategy ensures your results remain comparable over time, which is crucial for tracking sector performance and making informed investment decisions.
Setting Up Stock Screening Tools
Now that you’ve got a handle on sector classification systems, it’s time to choose a stock screening platform. These tools help you quickly identify opportunities in sectors you’re targeting. Let’s explore some top platforms and how to set them up effectively.
Stock Screening Platforms to Consider
For Singapore investors, several platforms stand out for sector-based screening, each offering tools tailored to different needs.
- ChartMill combines technical and fundamental indicators. It provides predefined ratings for quick analysis, while also letting you customise financial ratios to suit your criteria.
- Koyfin gives you the flexibility to create highly tailored screeners. You can filter by trading regions, industries, or even specific keywords, making it a great choice for focusing on SGX-listed stocks.
- EquityRT is ideal for market capitalisation analysis. It categorises companies into five tiers: Mega Cap (over S$105 billion), Big Cap (S$7 billion to S$105 billion), Mid Cap (S$1.4 billion to S$7 billion), Small Cap (S$70 million to S$1.4 billion), and Microcap (below S$70 million).
| Platform | Best For | Key Strength | SGX Support |
|---|---|---|---|
| ChartMill | Balanced fundamental & technical analysis | Predefined ratings + custom ratios | Yes |
| Koyfin | Highly customised screening | Regional and keyword filtering | Yes |
| EquityRT | Market cap analysis | Detailed peer comparisons | Yes |
When choosing a platform, focus on those that allow sector and sub-sector filtering, combine both technical and fundamental analysis, and let you save custom screeners. If you’re targeting SGX-listed stocks, make sure the platform supports them.
How to Set Up Your Screener
Once you’ve picked your platform, setting up your screener is straightforward. Start by creating an account, accessing the screener tool, and selecting your desired sector from the dropdown menu. Then, refine your results using advanced filters for specific industries or sub-industries.
For fundamental filters, platforms like ChartMill let you use predefined ratings for a quick overview or customise ratios for more control. If you’re focusing on Singapore stocks, consider factors like dividend yields or debt-to-equity ratios, which are particularly relevant to local investors. Add technical filters to identify favourable price trends and momentum, such as moving averages or relative strength indicators, aligning with your trading style.
To avoid low-quality stocks, apply quality filters. For instance:
- Set a minimum price of around S$7 to steer clear of penny stocks.
- Use a market capitalisation threshold of at least S$420 million for established companies.
- Filter for a minimum daily trading volume of 300,000 shares to ensure adequate liquidity.
Most platforms allow you to save and label multiple screeners tailored to different sectors or strategies, so take advantage of this feature.
Adjusting Filters for Singapore Markets
When screening for SGX-listed stocks, it’s important to adapt your filters to Singapore’s market characteristics. Focus on prominent sectors like banking, property, telecommunications, and consumer goods. A market capitalisation threshold of S$420 million can help you target established companies while excluding microcaps that may lack analyst coverage.
Make sure to display results in Singapore Dollars and adjust filters to reflect SGX’s liquidity and scale. Keep in mind that many Singapore companies have significant exposure to other Asian markets, and the regulatory environment often favours businesses with strong governance practices. Liquidity can be lower compared to larger international markets, so set realistic volume filters accordingly.
These screening tools work well with systematic trading strategies like those taught at Collin Seow Trading Academy, which focuses on the Singapore market. The academy incorporates combination screeners and technical indicators to pinpoint optimal entry points for strong stocks.
Applying Filters: Fundamental and Technical Analysis
Once your platform is set up, the next step is to apply both fundamental and technical filters. These tools can help you zero in on stocks with strong potential.
Fundamental Filters to Use
Fundamental filters are essential for assessing a company’s financial health and underlying value. Tailor these metrics to align with your investment goals and the sector you’re focusing on.
- Price-to-Earnings (P/E) ratio: This is a go-to metric for spotting overvalued stocks. Set thresholds based on the sector. For instance, banks might fall into a P/E range of 8–12, while tech stocks in growth phases could exceed 25.
- Market capitalisation: This helps narrow your focus to companies with enough size and stability. In Singapore, a minimum market cap of S$300 million is a good benchmark, particularly for sectors like REITs.
- Dividend yield: If you’re an income-focused investor, this is crucial. For Singapore’s dividend-heavy sectors, aim for minimum yields of 5% for REITs or 4% for telecommunications. Be cautious of yields above 8–10%, as they might indicate potential distribution cuts.
- Revenue growth: This metric shows how well a company is expanding. For aggressive growth strategies, look for annual revenue growth over 25%. In mature sectors like banking, more modest thresholds of 5–8% may be more realistic.
- Gross and operating margins: These reveal operational efficiency. Companies with gross margins above 50% and operating margins improving by more than 5% annually over the past three years are worth considering – especially in technology or healthcare sectors.
- Debt levels: Debt-to-equity ratios are key for evaluating financial stability. For Singapore REITs, aim for ratios below 0.5. Sectors like utilities or infrastructure may accommodate slightly higher ratios due to their steady cash flows.
Technical Filters for Price Trends
While fundamental analysis tells you what to buy, technical filters help you decide when to buy. These indicators focus on price trends and momentum.
- Moving averages: These are essential for spotting trends. Look for stocks trading above their 50-day moving average for short-term momentum or above their 200-day moving average for longer-term trends.
- Relative Strength Index (RSI): This tool helps identify overbought or oversold conditions. Keep RSI filters between 40 and 60 to find stocks with stable momentum.
- Relative strength: Compare stock performance to the overall market or sector index. Prioritise stocks showing positive relative strength over the past 3–6 months.
- Trading volume: Volume confirms price movements. Set a daily minimum of 300,000 shares to ensure liquidity. Increased volume during upward price trends often signals institutional interest.
- Price performance: This filter captures momentum without chasing extreme moves. Focus on stocks that have gained 10–30% in the past quarter.
How to Combine Both Filter Types
To get the most out of your analysis, combine your fundamental and technical filters strategically. Start by using fundamental metrics to eliminate financially weak companies. For instance, when analysing Singapore REITs, you might set a minimum market cap of S$1 billion, a dividend yield above 5%, and a debt-to-equity ratio below 0.5.
Once you’ve narrowed your list, apply technical filters to identify stocks with favourable price momentum. For example, focus on stocks trading above their 50-day moving average and with an RSI between 40 and 60.
“Collin’s methodology uses a precise blend of technical analysis and market trending factor to identify excellent entry points. This involves monitoring market cycles, understanding investor sentiment, and using combination screeners and technical indicators to pinpoint moments when strong stocks are poised for gains.” – Collin Seow
You can also create multiple saved screens tailored to different market conditions. For volatile markets, prioritise technical strength and momentum. In calmer periods, focus more on fundamental value metrics.
Remember, a fundamentally strong stock trading below key moving averages might be worth monitoring for a future opportunity. On the flip side, a technically strong stock with weakening fundamentals may only be suitable for short-term trades.
Keep your filters up-to-date to reflect changing market conditions. Review and adjust them quarterly or whenever significant shifts occur in the economy or specific sectors.
Master Systematic Trading with Collin Seow
Learn proven trading strategies, improve your market timing, and achieve financial success with our expert-led courses and resources.
sbb-itb-466c9b0
Reviewing and Understanding Your Results
Once you’ve applied your filters, you’ll likely end up with a list of stocks to evaluate. The challenge is to organise this data effectively so you can spot the most promising opportunities without feeling overwhelmed.
How to Sort and Organise Results
Most screening platforms present results in a table format, but the default setup may not highlight the best options. Start by sorting your results based on market capitalisation – this helps you focus on larger, more established companies first. Next, sort by metrics like price-to-earnings (P/E) ratio to identify potentially undervalued stocks. This method works well in cyclical industries like banking or commodities, where temporary earnings dips might create attractive buying opportunities. For growth-driven sectors like technology, sorting by revenue growth can help you pinpoint companies with strong expansion potential.
Another key factor is trading volume, which indicates liquidity. Setting a minimum daily volume of 300,000 shares ensures there’s enough liquidity, often a sign of institutional interest.
Most platforms allow you to customise column displays and save your preferred views. You could create one layout focusing on value metrics like P/E ratio and dividend yield, and another highlighting growth metrics such as revenue growth and gross margins. Once your list is sorted, you can dive into a detailed comparison of key metrics.
Comparing Stocks Within the Same Sector
To make meaningful comparisons, benchmark stocks against sector averages. Use a table like the one below to evaluate stocks in the same sector within the context of industry-specific benchmarks.
| Metric | Singapore Bank A | Singapore Bank B | Singapore Bank C | Sector Average |
|---|---|---|---|---|
| Market Cap (S$) | 45.2 billion | 38.7 billion | 28.1 billion | 35.0 billion |
| P/E Ratio | 11.2 | 9.8 | 12.5 | 11.5 |
| Return on Equity (%) | 12.8 | 11.4 | 10.9 | 11.2 |
| Debt-to-Equity | 0.15 | 0.18 | 0.22 | 0.18 |
| Dividend Yield (%) | 4.2 | 4.8 | 3.9 | 4.3 |
For instance, this table reveals that Bank B offers the highest dividend yield while trading at a lower valuation, though its return on equity is slightly below the sector average. On the other hand, Bank A demonstrates strong profitability but comes with a higher valuation. Metrics like ROE can shed light on management efficiency, while debt-to-equity ratios provide insights into financial stability. Additionally, revenue growth can highlight market share gains – modest growth of 3–5% might be impressive in sectors like telecommunications, but emerging industries like renewable energy often aim for annual growth above 20%.
“At the heart of Collin’s approach to selecting excellent trades or investments is via a focus on strong stocks. These are stocks that not only show innate strength in comparison to the market, but also the potential for sustained trends and growth.”
After this step, you’ll be ready to refine your list further.
Picking the Best Stocks for Further Research
Once you’ve compared the key metrics, it’s time to identify standout candidates. Look for stocks that consistently exceed sector averages across multiple metrics. Those ranking in the top 25% for both profitability and growth deserve closer attention. Conversely, eliminate stocks with declining revenue, high debt levels, or signs of unstable management.
Price momentum can also provide valuable clues. Stocks showing positive relative strength over the past 3–6 months may signal institutional buying or improving fundamentals. Focus on those outperforming both their sector index and the broader Straits Times Index during this period.
Liquidity is another factor to consider, especially if you’re planning larger positions. Ensure there’s sufficient daily trading volume to support your exit strategy when needed.
Finally, assess each company’s industry position. Companies with dominant market share, strong competitive advantages, or exposure to fast-growing market segments often justify higher valuations. Research their competitive moats and any potential catalysts that could drive future performance.
Best Practices for Managing Your Screeners
To keep your stock screeners effective, it’s essential to manage them systematically. Successful traders often take a disciplined approach to ensure their screening tools stay relevant, even as market conditions shift.
Adjusting Screeners for Your Trading Style
Your screener should align with your trading philosophy and risk tolerance. Different strategies call for different filters. For example:
- Value Investors: If you’re into value investing – especially in sectors like healthcare or utilities – focus on filters such as P/E ratios below 15, dividend yields above 3%, and consistent positive cash flow. A healthcare value screener might target companies trading below book value with steady dividend payouts over the past five years. These filters help highlight companies that may be undervalued but have solid fundamentals.
- Momentum Traders: For momentum trading, technical indicators take precedence over fundamentals. Look for stocks trading above their 50-day and 200-day moving averages, with a relative strength index (RSI) above 60. These metrics can help identify stocks with strong upward trends.
- Growth Investors: Growth-focused investors should emphasise revenue expansion and market share growth. Screen for companies with annual revenue growth above 25% and gross margins exceeding 50%. In emerging industries like renewable energy or artificial intelligence, such growth metrics often point to companies seizing market opportunities.
Modern screening platforms allow you to create multiple screeners tailored to various market conditions. For instance, you might have one screener focusing on growth metrics for bullish markets and another prioritising defensive characteristics – like low debt and stable cash flows – for bearish phases.
Saving Screeners for Future Use
Most stock screening tools, such as ChartMill and EquityRT, let you save custom screeners for easy access later. This feature is especially helpful when managing multiple strategies or monitoring different sectors. After setting your filters, use the “Save Screener” or “Save as Watchlist” option and give it a descriptive name.
Naming conventions matter. Instead of vague names like “Screener 1”, opt for something specific, such as “Tech Momentum Q4 2024” or “Healthcare Value Dividend Focus.” Clear labels make it easier to find the right screener when market conditions change.
Saved screeners pair well with watchlists for tracking promising stocks. For instance, you could create watchlists for categories like “Banking Prospects”, “Tech Growth Candidates”, or “REIT Income Plays.” This organisation lets you monitor stock performance over time and identify ideal entry points.
Certain platforms, like EquityRT, even update watchlists automatically. In fact, 78% of users save custom setups for this reason. You can also set alerts for key price or volume movements, such as when a stock hits a 52-week high, drops below a support level, or posts unexpected earnings results. These alerts help you stay informed without needing to monitor every stock manually.
When to Review and Update Your Screeners
Markets are dynamic, so your screeners need regular updates to remain effective. A good rule of thumb is to review your criteria monthly, though you might need more frequent updates during volatile periods or major economic shifts.
Economic cycles often dictate how you should adjust your screeners. During periods of economic growth, cyclical sectors like technology, consumer discretionary, and industrials tend to outperform. In such times, your screeners should focus on growth metrics and momentum indicators. On the other hand, during economic slowdowns, defensive sectors like healthcare, utilities, and consumer staples become more appealing. Here, filters for dividend yields, low debt levels, and stable cash flows are more relevant.
Sector rotation also plays a role. If technology stocks have been leading the market, consider whether valuations have become too high. It might be time to shift your focus to underperforming sectors that could be poised for recovery.
According to 2024 data from ChartMill, users who frequently update their screeners report a 25% higher success rate in spotting outperforming stocks compared to those who rely on static criteria. This highlights the importance of keeping your filters current.
Quarterly earnings seasons often reveal shifts in fundamentals that warrant screener updates. For example, if a sector’s P/E ratio changes significantly due to earnings growth or contraction, adjust your valuation filters. Similarly, if interest rate changes affect dividend-paying stocks, tweak your yield requirements to match the new environment.
To refine your screeners further, monitor sector performance data regularly. Platforms like ChartMill and EquityRT provide analytics showing which industries are gaining or losing momentum. Use this data to focus on sectors with improving fundamentals or appealing valuations.
Set a review schedule based on your trading style. Active traders might review screeners weekly, while long-term investors may find monthly or quarterly updates sufficient. Consistency is key – regular reviews ensure your screeners stay relevant and help you spot emerging opportunities.
Finally, track the performance of your screeners. Keep records of which filters consistently identify strong stocks and which ones fall short. Over time, this data will help you fine-tune your approach and build more effective screening strategies.
Conclusion
Sector-based stock screening offers a structured way to refine your investment decisions by zeroing in on opportunities within specific economic sectors. This guide has outlined key steps – from understanding classification systems like GICS, ICB, and TRBC to customising screening platforms for Singapore’s markets.
By leveraging sector rotation, you can identify potential growth and value opportunities while steering clear of underperforming or illiquid stocks in the Singapore market. Combining fundamental filters (such as P/E ratios and dividend yields) with technical tools (like moving averages and relative strength indicators) creates a disciplined and effective stock selection process. This approach minimises emotional decision-making and encourages a more methodical investment strategy.
To stay ahead, ensure your screeners are updated regularly to account for changing market conditions and economic cycles. Whether you’re focusing on more stable sectors during uncertain times or targeting growth sectors in periods of expansion, your screening process should adapt to these shifts.
This systematic approach addresses key investment questions: what to trade, when to trade, and how much to invest. By following these strategies, you can build a more disciplined and sustainable investment framework.
Start applying these techniques today by selecting a sector that matches your market outlook, setting appropriate filters for Singapore-listed companies, and keeping your screeners up-to-date. For additional insights into systematic trading strategies, consider exploring the resources available at Collin Seow Trading Academy.
FAQs
How can I select the best sector classification system for my investment strategy in Singapore?
Choosing the right sector classification system largely depends on what you’re aiming to achieve with your investments and how much detail you require. Popular systems like the Global Industry Classification Standard (GICS) and the Industry Classification Benchmark (ICB) are commonly used because they offer straightforward sector breakdowns. If you’re investing in Singapore, you might also want to explore classifications tailored to the local market, such as those provided by the Singapore Exchange (SGX).
To decide which system works best for you, think about how it fits into your trading strategy. For instance, if your focus is on Singapore-listed stocks, local classifications could give you insights that are more directly relevant. Platforms like Collin Seow Trading Academy can also be valuable, offering tools and guidance to help you analyse sector performance and fine-tune your stock screening process.
What is the difference between fundamental and technical stock filters, and how can I use them together for better results?
When evaluating stocks, fundamental filters help you gauge a company’s financial health by looking at factors like revenue, profit margins, and debt levels. These filters are essential for spotting companies with strong financial performance within a particular sector. Meanwhile, technical filters focus on analysing price movements, trading volume, and chart patterns to identify the best times to buy or sell.
To make the most of both methods, start by using fundamental filters to narrow down stocks that are financially solid. Once you’ve identified these, apply technical filters to determine the ideal timing for your trades. This strategy allows you to invest in quality stocks while aligning your trades with market trends.
How frequently should I update my stock screeners to keep them aligned with Singapore’s market trends?
To keep your stock screeners effective in Singapore’s ever-changing market, it’s important to update them regularly. Consider factors like quarterly earnings reports, economic data releases, or major policy changes. A monthly review is a good starting point, but during periods of high market volatility or significant sector developments, you might need to make adjustments more often.
By ensuring your screeners reflect current market trends, you’ll be better equipped to spot promising opportunities and respond to shifts in the market. Staying updated on local economic news and sector performance is equally important for making informed screening decisions.