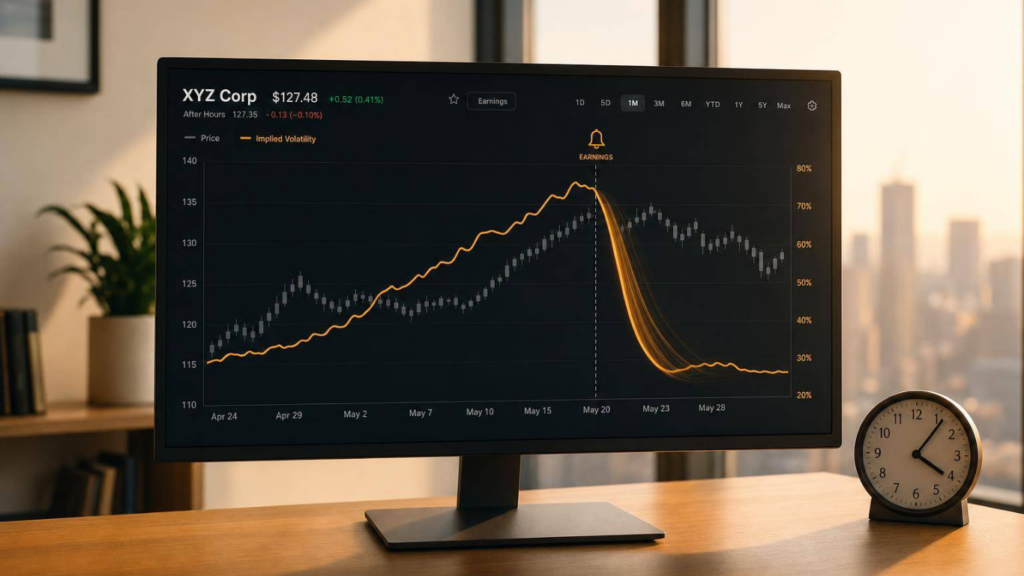
You can get the stock direction right and still lose money on an earnings options trade. That usually happens because implied volatility (IV) drops after results, and that drop can wipe out option value fast.
If I had to sum up IV crush in one line, it would be this: before earnings, options often price in fear and uncertainty; after earnings, that extra premium disappears. In many cases, IV can fall by 20% to 60% overnight, with short-dated options taking the hardest hit.
Here’s the part I’d want you to know first:
- IV usually climbs before earnings because traders expect a big move.
- IV often falls right after earnings because the event is over.
- Long calls, long puts, and straddles can lose even when the stock moves your way.
- Short premium trades like credit spreads and iron condors often do better when IV drops.
- The key question is not just “Will the stock move?” but “Will it move more than the market already priced in?”
A simple example: if your option has vega of 0.30 and IV drops by 15 points, that alone can cut about S$4.50 from the option’s value. So even a good stock move may not save the trade.
This piece looks at the full earnings IV pattern, what happens to front-month options, how realised moves compare with implied moves, and which setups tend to get hurt or helped by the post-results volatility reset.
sbb-itb-466c9b0
What Is Implied Volatility Crush Around Earnings
IV crush is the fast drop in option premium after earnings, when uncertainty fades and implied volatility resets. Once a company posts results, the uncertainty premium comes out of the option, and IV can fall by 20% to 60% in a single session soon after the announcement. That drop strips out extrinsic value in a hurry. It also helps explain why earnings options often look expensive before the report and then get hit hard after it.
This is a volatility effect, not a direction effect. A long call or long put can still lose value even if the stock moves the way you wanted.
Why IV Usually Rises Before Earnings
Before earnings, traders pay up for event risk, so option premiums go up. The release can spark a big overnight move, and that possibility gets priced into options ahead of time.
There’s also a simple mechanical reason IV moves higher. As the earnings date gets closer, the same expected move is spread across fewer days, so annualised IV rises even if the expected move stays the same.
Why Option Buyers Can Lose After Getting the Direction Right
Getting the direction right is only half the trade. If IV drops more after earnings than the stock move adds to the option’s price, you can still lose money.
A good example is Palantir. Leading up to PLTR’s 4 May 2026 earnings report, implied volatility climbed to nearly 90%. After the company reported strong growth numbers and lifted guidance, the IV rank dropped into the low 20s within a few days. That’s a textbook IV crush, even with good news.
“IV crush means you can be right on direction and still lose money on a long options position.” – Tomasz Dobrowolski, Founder, FlashAlpha
That’s why short-dated contracts often take the hardest hit.
How Earnings Announcements Affect Option Prices and IV
Earnings tend to hit the volatility side of option pricing the hardest. Before results come out, implied volatility (IV) usually climbs because the market is pricing in uncertainty. After the report, that uncertainty is gone, so IV often drops. You’ll usually see this most clearly in front-month options.
Here’s a simple example: a call with vega of 0.30 loses S$4.50 from a 15-point IV drop. So even if you get a S$3.00 favourable delta move, you’re still down S$1.50 net.
Why Short-Dated Options Often Show the Biggest IV Changes
Short-dated options hold the most event premium, which is why they usually take the biggest IV hit after earnings.
For an option that expires right after the announcement, earnings can make up 60–80% of the total remaining variance in the contract, as seen in high-volatility names like Nvidia (NVDA). Remove that event risk overnight, and the option premium can fall hard. With a longer-dated option that expires months later, the same earnings report is only a small part of the total time left, so the IV effect is much softer.
Before earnings, front-month IV can even trade above longer-dated IV. That creates a short-term kink in the curve. Once the report is out, that extra front-end premium gets reset first.
What Happens When the Actual Move Is Smaller Than the Implied Move
Before earnings, options already price in an expected move. If the stock moves less than that, option premium can drop fast – even when you got the direction right.
In October 2023, Apple (AAPL) reported earnings with a market-implied move of S$8, but the stock moved only S$3. The stock did move, but not by enough to make up for the premium that had already been baked into the option price. So traders who bought options still lost money because the actual swing came in well below what the market had priced in.
That difference between the implied move and the realised move is what traders watch closely around earnings.
Pre-Earnings and Post-Earnings IV Patterns Traders Should Watch
Most of the pre-earnings IV build shows up in the last 10 days. Then it tends to speed up in the final 2 to 3 sessions. As the earnings date gets closer, the same expected variance is squeezed into fewer days. That pushes quoted IV higher even when nothing has changed at the business level. That’s the pre-earnings premium traders are paying for.
How IV and Option Premiums Build Before Earnings
A day or two before earnings, IV on the earnings-week expiry can sit 40% to 100% above the trailing 30-day average for large-cap stocks. That higher IV flows straight into option premiums, because buyers are paying an uncertainty premium to stay in the trade through the event.
Skew is another thing to watch. Before earnings, put skew often gets wider as traders bid up downside protection. In plain English, out-of-the-money puts start carrying higher IV than calls. That can point to hedging demand stacking up on the downside.
By this stage, front-week options usually hold most of the event premium. That’s why front-week earnings options can look expensive even before the numbers are out.
The same expected move that lifts premiums before earnings is also what vanishes after the report.
Post-Earnings IV Contraction and Its Effect on Buyers and Sellers
Once earnings hit, the premium tends to disappear first. Price direction comes after. IV often drops hard within the first 15 to 30 minutes of trading, and it can fall 20% to 60% overnight.
The size of the crush depends mostly on how the realised move compares with the implied move. If the stock moves less than the market had priced in, the crush is often harsher.
For option buyers, that IV drop can rip out extrinsic value fast, even when the stock moves in the right direction. For sellers, that post-earnings reset is the part they want to collect. This is a core component of a systematic trading program designed for consistent results.
How IV Crush Affects Different Options Strategies
IV crush doesn’t hit every options trade the same way. The big divide is simple: are you long premium or short premium before earnings?
Long Calls, Puts, and Straddles Before Earnings
For long options, the problem is built into the trade. When you buy a call, a put, or a straddle before earnings, you’re paying a premium that already includes pumped-up IV. Once the results are out and the uncertainty is gone, that premium can shrink fast.
A real trade makes this clear. AAPL was at US$180. A US$185 call cost US$4.20 at 75% IV. After earnings, the stock opened at US$189, but IV dropped to 35% and the option rose only to US$4.50. That’s a gain of just US$0.30, or about 7%.
That stings a bit, right? The stock moved in the right direction, yet the option barely paid off.
A long straddle runs into the same issue on both sides. The stock has to move far enough to cover the total premium paid. That’s a tough ask when the expected move was already priced in before the report.
Short Premium Trades, Credit Spreads, and Defined-Risk Setups
Now flip the setup around. Traders who sell premium usually want that IV reset. Sellers of straddles, strangles, iron condors, and credit spreads are short vega, so when IV falls after earnings, that drop helps their position.
Apple’s October 2023 earnings show this well. AAPL moved only US$3 while the market had implied a move of US$8. So traders who sold straddles came out ahead because the actual move was much smaller than what the options market had priced in.
But selling premium isn’t a free lunch. The danger is a move that blows past the implied range. In January 2023, Tesla (TSLA) fell US$22 against an implied move of just US$12. That hurt volatility sellers even though IV crush was still on their side.
This is why defined-risk setups matter. Iron condors and credit spreads put a cap on the downside. They also need less margin and have capped losses, which makes them a better fit for smaller accounts.
| Strategy Type | Sensitivity to IV Crush | Potential Benefit from IV Crush | Key Risk if Realised Move Exceeds Implied | Typical Use Around Earnings |
|---|---|---|---|---|
| Long Call/Put | High (Negative) | None; IV drop hurts value | Vega loss exceeds Delta gain | Directional bet on a massive surprise |
| Long Straddle | High (Negative) | None; requires huge move | Stock stays within implied range | High-volatility “breakout” bets |
| Short Straddle | Extreme (High Vega) | Maximum; full extrinsic collapse | Unlimited directional loss | Aggressive play for experienced traders with large accounts |
| Iron Condor | Moderate | High; IV collapse on both wings | Loss capped at wing width minus credit | Standard strategy for small-to-mid-sized accounts |
| Credit Spread | Moderate | Moderate; crush on the short leg | Loss capped at spread width | Directional bias combined with a volatility-selling edge |
| Calendar Spread | High (Differential) | High; front-month IV crushes faster | Large price gaps can overwhelm the volatility benefit | Pure volatility play on term structure |
“IV crush is direction-agnostic. It cares that uncertainty resolved. Sell the uncertainty before it resolves, and let the crush do the work.” – Andy Crowder, Professional Options Trader
Risk Management and Planning for IV Crush
Once you understand how IV crush can shape a trade, the next step is managing event risk. That only works if you plan the trade properly before you enter it. A simple pre-entry checklist goes a long way.
Start with the earnings date. Check whether the date on your earnings calendar is confirmed or tentative. This matters more than many traders think. If the date moves and your option expires before the announcement, you won’t get the IV crush at all.
Next, see if IV is actually expensive. Use IV Rank or IV Percentile to judge whether option premium is rich compared with the past 52 weeks. An IV Rank above 70 usually suggests premium is rich and more likely to compress after earnings. When IV is already high, you need tighter risk control.
Then size the trade in S$ terms, not just by contract count. A trade can look small in contracts and still be too big for your account. After setting position size, decide on your exit before the earnings report. For defined-risk setups like iron condors or credit spreads, cap risk at 1%–2% of your portfolio per event. For undefined-risk trades, keep it to 0.5%. One bad gap should not throw the whole portfolio off course.
Finally, be disciplined about timing. The best window for entering volatility-selling trades is usually 1–2 days before the announcement, when IV tends to be at its highest. After the market opens, trim or close volatility-selling trades fast, because most of the crush tends to happen early.
FAQs
How do I estimate the implied move before earnings?
Use the at-the-money straddle for the nearest expiry. Just add the at-the-money call premium and put premium at the same strike and expiry.
To work out the expected move as a percentage, divide that total by the current stock price. If you want a closer one-standard-deviation estimate, multiply the straddle price by 0.85.
Example: if a stock is S$200.00 and the straddle costs S$9.00, the implied move is 4.5%. That gives you an estimated range of about S$192.35 to S$207.65.
Should I avoid buying weekly options before earnings?
Often, yes. Many experienced traders stay away from buying options right before earnings because implied volatility is often pumped up in the run-up to the announcement.
Then comes the problem: IV crush. After earnings are out, implied volatility can drop hard. And that drop can slash an option’s price even if the stock moves in the direction you wanted.
Weekly options get hit the most because they have so little time left.
If you still want to trade earnings, defined-risk setups like:
- vertical spreads
- iron condors
- calendar spreads
It can help you deal with the drop in IV.
How can I tell if IV is already too high?
Check whether IV Rank and IV Percentile are both elevated. As a simple rule of thumb, an IV Rank above 70 suggests you may be paying premium prices. That makes naked long call positions riskier.
It also helps to compare the event-expiry IV with longer-dated expiries. If the front-week IV is much higher, the market has likely already priced in a major binary event. In plain English: you’re looking at a setup with a bigger chance of an IV crush.