About the Company (NYSE: DECK)
Deckers Outdoor Corporation designs, markets, and distributes innovative footwear, apparel, and accessories for casual lifestyle use and higher performance activities in US and internationally. It is renowned for its brands UGG, Teva, Sanuk, Hoka, and Koolaburra.
Stock background:
Since mid-2024, Deckers has underperformed the broader S&P 500 index and the Consumer Discretionary Sector index on valuation concerns and slower growth. Tariff worries also seem to be weighing as the company produces a lot of its shoes in Asia. Following the recent decline, Deckers is now trading around its five-year average, which makes it attractive relative to the broader S&P 500 Index, although not a screaming buy on an absolute basis.
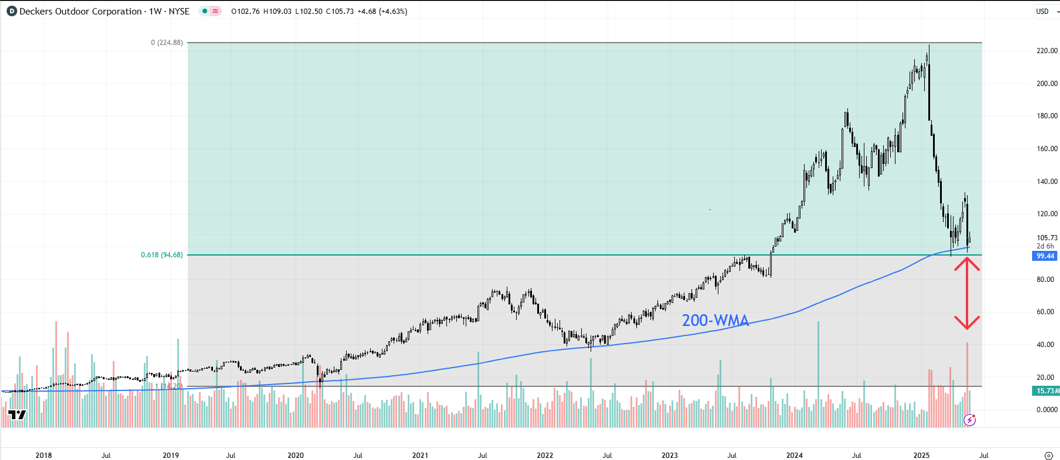
Deckers Outdoor Corporation (NYSE: DECK) – Weekly Chart
Most recently, Deckers Outdoor plunged over 18% on May 23, the biggest single-day drop since 2012 even as the company beat expectations, as investors preferred to focus on the weak guidance. Daily volume on May 23 was the highest since March 2024, according to TradingView data. Extreme high volume after a long decline despite an earnings beat, is a sign of capitulation. Bears are possibly getting exhausted.
Technical Analysis on Deckers Outdoor (NYSE: DECK)
After making a record high in January, Deckers has declined for 10 straight weeks before consolidating slightly around quite strong support at 94.50 (the 61.8% retracement of the rise from 2020) and the 200-week moving average. Weekly volume in the week ended May 23 was the highest since March 2024. The 14-week Relative Strength Index dropped into deep oversold territory, hitting the lowest level since 2022. When RSI fell to 23 in 2022, the stock subsequently bottomed.
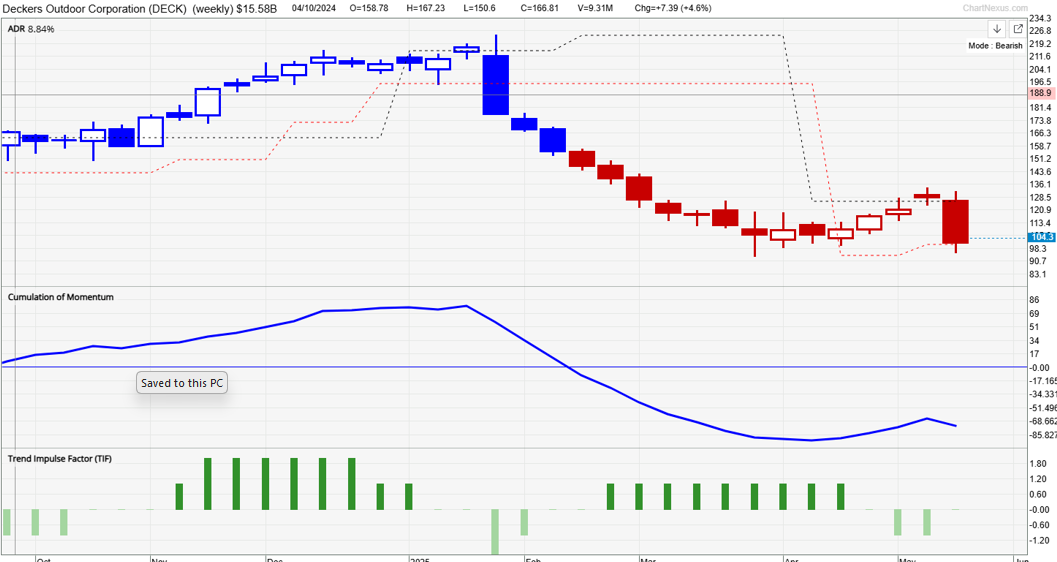
Our proprietary system TradersGPS (TGPS) gave a bearish signal mid-February when the colour of the candles changed to Red from Blue on the weekly candlestick chart. As per our system, Blue candles indicate the stock’s trend is up, while Red candles indicate the stock’s trend is down. While the colour of the candles is still to change to bullish, a potential positive momentum divergence (Cumulation of Momentum indicator) is an encouraging sign for bulls. Any break above the May high of 133.50 would be a strong sign that the downward pressure had faded.
I’d be on the lookout for any change in fortune of the heavily battered stock!