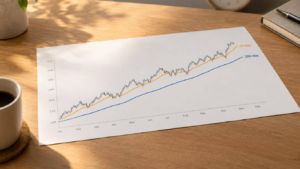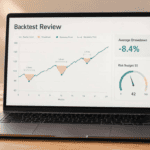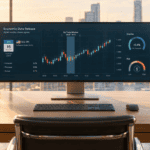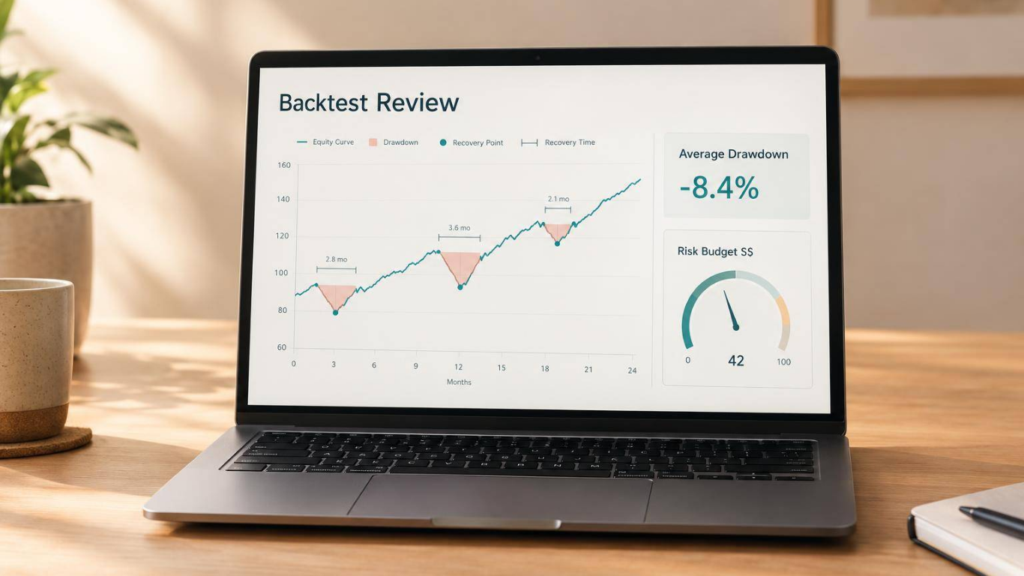
I use average drawdown to check typical losses – not to set a loss limit. A 10% drawdown on S$50,000 means S$5,000 below the account’s peak. Before trusting a backtest’s returns, I check whether you could afford both the losses and the wait for recovery.
Here’s what I check:
- The calculation: count each completed decline once, using its own peak. Report unfinished declines separately.
- The equity path: include unrealised losses and trading costs, then compare average loss, worst loss, frequency and recovery time.
- The test: check data and rules, profit concentration, unseen data, different market conditions and shuffled trade sequences.
- Your budget: translate typical and stressed losses into S$, then check cash, margin and how long you can wait.
A low average can still hide a deep loss. <u>Past drawdowns do not cap future losses.</u> If the stressed loss or recovery period exceeds your budget, I would reject the system rather than focus on its headline return.
How to Calculate Average Drawdown
Reporting tools don’t all calculate drawdown the same way. This guide counts each completed drawdown once.
Identify Peaks, Troughs and Completed Drawdowns
Use the same equity series throughout so your average reflects actual drawdown stress. Sort the observations chronologically and track the running peak.
A drawdown episode starts when equity falls below that peak. It ends when equity returns to the peak or moves above it. Record the lowest equity reached during the episode. A partial recovery doesn’t start a new episode.
Closed-trade balance excludes unrealised profit and loss. Mark-to-market equity includes it, so it better reflects stress while trades remain open. A smooth closed-trade curve can hide painful pullbacks in open positions.
Calculate the Mean Drawdown Depth
Calculate the percentage depth of each completed episode using that episode’s peak, not the starting account balance. Then add the depths and divide by the number of completed episodes. Express depths as positive percentages:
[ \text{Drawdown depth} = \frac{\text{Peak equity} – \text{Trough equity}}{\text{Peak equity}} \times 100% ]
[ \text{Average drawdown} = \frac{\text{Sum of completed episode depths}}{\text{Number of completed episodes}} ]
State your test dates, equity source, sampling frequency, episode count and whether costs are included. Daily sampling can miss losses that happen and recover within the day.
Leave the current unfinished episode out of the average. Report its peak date, deepest decline, current drawdown and elapsed duration separately. If no episodes have completed, report unavailable, not 0%.
Example: 3 Completed Drawdowns
Hypothetical calculation: Completed depths of 5%, 10% and 15% produce an average of 10%: (5% + 10% + 15%) ÷ 3, equivalent to S$5,000 on an intended S$50,000 account for risk-budget illustration only. Historical dollar drawdowns must be measured separately for each episode as peak equity minus trough equity.
sbb-itb-466c9b0
Assess Returns, Drawdowns and Recovery
Use average drawdown alongside the path metrics below to assess whether the returns came with equity stress you could tolerate.
Compare Drawdown Metrics
Average drawdown tells only part of the story. Compare these five measures across the same test period to understand the full equity path:
| Metric | What it measures | Primary question | Limitation |
|---|---|---|---|
| Average drawdown | Mean depth of completed declines | How severe was a typical decline? | Can hide rare, extreme losses and depends on how drawdowns are defined |
| Maximum drawdown | Largest historical peak-to-trough decline | What was the worst observed loss from an equity peak? | Does not set a ceiling on future losses |
| Drawdown duration | Time from the prior peak until equity recovers to that peak | How long could capital remain below its former high? | A shallow decline can last a long time; a severe loss can have a short duration |
| Recovery time | Time from the trough until equity returns to the prior peak | How quickly did the strategy recover from its low point? | Excludes the time spent falling from peak to trough |
| Frequency | Number of completed drawdowns in the period | How often did declines occur? | Changes with the sampling interval, threshold and rule for merging declines |
State any minimum depth threshold. Keep unrecovered episodes separate: a drawdown still open at the end of the test has no completed recovery time, so it should not count as a completed observation.
Master Systematic Trading with Collin Seow
Learn proven trading strategies, improve your market timing, and achieve financial success with our expert-led courses and resources.
Check Equity Stress and Profit Concentration
Read total and annualised returns alongside average drawdown, maximum drawdown and recovery time. A 20% decline needs a 25% gain to regain the previous peak. Check rolling annual returns and drawdowns by market regime. Attractive returns can mask frequent declines, deep losses or long periods without a new high.
Check how much net profit comes from the largest trades, best months and strongest years. Remove the largest winners and rerun the metrics as a sensitivity test, not a revised forecast.
Compare mark-to-market equity with the closed-trade balance curve, peak margin usage and available cash. Plot percentage and S$ drawdowns separately, as a single chart scale can hide material losses.
Spot Backtest Warning Signs
Use these flags to identify parts of the backtest that need closer review. No single flag proves that a system is unsuitable:
- Low average, severe maximum drawdown: check backtest tail exposure, leverage, correlated positions, liquidity and the market regime during the worst episode.
- Long recoveries or frequent declines: compare backtested time underwater with your intended investment horizon.
- Few completed episodes: treat the average as uncertain, especially if the final drawdown remains unrecovered.
- Concentrated profits: test how results change if you miss winning trades or see weaker performance in the best months and years.
- Unclear costs or exposure: verify modelled fees, spreads, slippage, financing, contract size, leverage, position sizing and margin treatment. Unrealistic fills and missing costs can overstate performance.
- No out-of-sample test: validate on unseen data without retuning after seeing the results to check for overfitting.
- Smooth balance, stressed equity: inspect backtested open-position losses and potential liquidation risk.
Any one of these flags warrants a closer audit of the backtest inputs and assumptions, including its data, rules and costs.
Build a Backtest Review Process
Use average drawdown as your benchmark, then check the inputs that could distort it.
Check Data, Trading Rules and Costs
Maintain a versioned checklist covering test dates, markets, instruments, data vendor, timestamps, corporate actions, missing data, cash flows, account currency, code version and rule changes. Record how you mark open positions to market and handle unrecovered drawdowns. Signals must use only information available at the decision time. Include delisted securities from the same universe.
Keep validation data separate from development data. Before the out-of-sample run, freeze entry, exit, sizing, stop-loss, leverage and portfolio-risk rules. State whether results include commissions, exchange or platform fees, spreads, slippage, market impact, financing and borrow costs. Then stress-test with increased spreads and delayed fills.
With those checks done, test whether average drawdown holds up across different market conditions.
Test Market Regimes and Trade Order
Check calm and stressed regimes separately. Compare rising, falling, sideways and high-volatility periods with the same sizing and cost assumptions. This helps you see whether average drawdown stays stable as conditions change. State whether you count only completed drawdowns.
Hypothetical review worksheet – not historical performance. Recovery time shows the longest completed trough-to-recovery interval in each row.
Test period Net return Average drawdown Maximum drawdown Recovery time Completed episodes Key assumption In-sample development 42% 3.8% 14.2% 11 months 18 After estimated costs Out-of-sample validation 16% 5.1% 12.7% 9 months 9 Rules frozen before testing High-volatility regime 9% 7.4% 21.6% 15 months 6 Same sizing and cost model
Use Monte Carlo trade-order resampling to rebuild equity paths by shuffling completed trades into many different sequences. Record median and adverse-percentile drawdowns, losing streaks and recovery times. Simple reshuffling misses serial dependence and overlapping positions, so treat the results as stress-test evidence, not a forecast.
Set an S$ Drawdown Risk Budget
After checking the equity paths, convert drawdown into S$ amounts you can tolerate. Multiply typical and stressed drawdown percentages by your intended account value. These are planning estimates, not historical dollar losses unless they occurred at that account size.
Check whether clustered losses, simultaneous positions and margin demands leave enough cash to keep trading the system and meet personal commitments. Record how long you can wait for recovery without withdrawing needed capital or abandoning the rules.
Set decision thresholds before the out-of-sample run. When drawdown changes without explanation, check the data, code, execution and regime assumptions. Reduce exposure when losses exceed your capital budget. Reject a strategy if its stressed loss or recovery period is unaffordable.
Resizing means recalculating position sizes, costs, margin use and every drawdown metric – not just scaling the headline percentage. Base your limit on your own capital, margin and recovery tolerance.
Conclusion: Use Average Drawdown in Risk Decisions
Use average drawdown as a final filter for backtests that look smooth but spend too long underwater. State the formula, sampling frequency, equity basis and starting capital. Count each completed peak-to-trough drawdown once. Include open trades and all trading costs in the equity series.
Report any open drawdown separately, with its current depth and time underwater. Its final depth and recovery time are still unknown.
Check whether the open loss and recovery path fit your capital plan. Before deciding whether you can tolerate the equity path, read average and maximum drawdown in both % and S$, alongside duration and recovery time.
Use realistic fees, spreads, slippage and fill assumptions. Historical drawdowns do not cap future losses. If the drawdown profile exceeds your risk budget, reject the system, no matter how good its headline return looks. Average drawdown helps you judge whether you can survive the path to profit – not just whether the system makes money.
Collin Seow Trading Academy offers systematic trading courses, free e-courses, live webinars, trading books, and free video content for further study.
FAQs
How many drawdown episodes make a backtest reliable?
There’s no fixed number of drawdown episodes that makes a backtest reliable. What matters is having enough trades – typically 50 to 100 or more – to account for natural market variability. Stress testing and Monte Carlo simulations can help identify potential drawdowns that a single historical path might miss.
Collin Seow Trading Academy offers educational resources to help you learn these systematic strategies and improve your trading skills.
How can I spot misleadingly smooth equity curves?
Be wary of returns that look too good to be true, especially when paired with minimal drawdowns. They may reflect overfitting to historical noise rather than actual market behaviour. A correlation coefficient above 0.95 indicates strong, linear growth.
Strong historical results followed by poor performance on new data also suggest overfitting. Avoid excessive parameter fine-tuning. Use out-of-sample testing to check whether the strategy’s edge holds up in market conditions it hasn’t seen before.
How should I set my S$ drawdown budget?
Limit risk to 1–2% of your capital per trade to help keep portfolio drawdowns in check. Professional traders often target maximum drawdowns below 20–25%. The deeper the loss, the larger the gain needed to recover.
Consider a 30% circuit breaker that automatically closes positions to protect your remaining capital. Allow a buffer, too: drawdowns in live trading are often 1.5–2 times higher than backtest results.