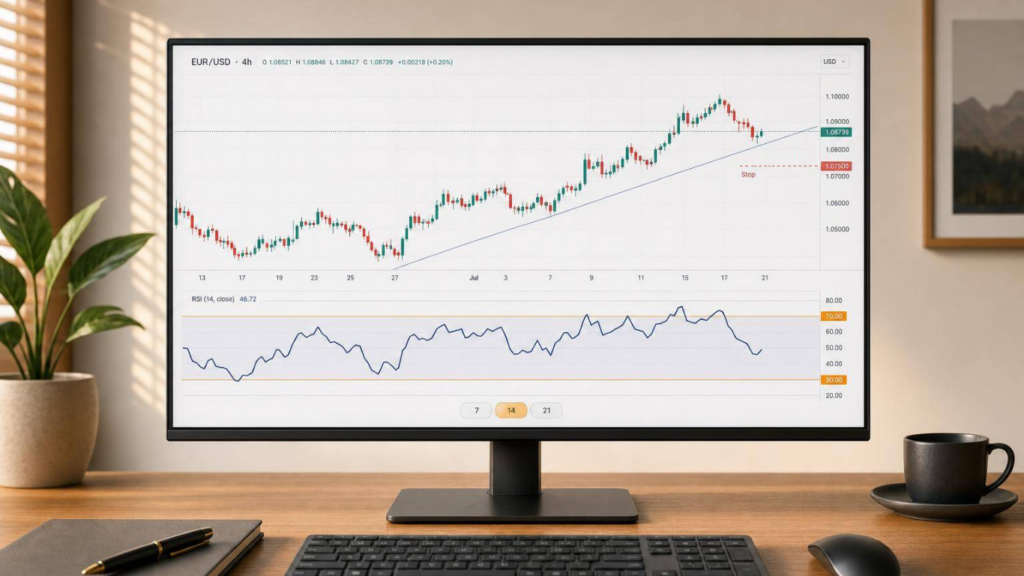
RSI helps me judge momentum fast: above 70 often means price has run hard, below 30 often means price has dropped hard, but neither level guarantees a turn. If I use RSI well, I focus on three things: the formula, the setting length such as 7, 14, or 21 periods, and the signal type such as threshold moves, divergence, and pullbacks.
Here’s the short version:
- RSI is a 0–100 oscillator based on recent gains versus recent losses.
- RSI(14) is the default because it sits between a fast and slow reading.
- 30/70 gives more signals, while 20/80 is stricter and gives fewer.
- A high RSI does not automatically mean “sell”.
- A low RSI does not automatically mean “buy”.
- In a strong trend, RSI can stay near extremes for a long time.
- I’d treat RSI as a timing tool, not a trade trigger on its own.
- I’d confirm it with trend, support/resistance, volume, and stop-loss rules.
What matters most: RSI is simple to calculate, but the hard part is using it in the right market context. On lower timeframes, noise can distort signals. On higher timeframes, signals tend to be calmer but less frequent. So if you want cleaner setups, match timeframe + setting + risk control before you place a trade.
This article breaks that down in plain English so you can read an RSI chart without overreacting to every move.
sbb-itb-466c9b0
RSI Formula: Step-by-Step Calculation
RSI starts with one simple input: the change from one closing price to the next. From there, each change moves through a short sequence that leads to one RSI reading, based on the standard 14-period setting. This default version is RSI(14), which the next section covers in more detail.
From Price Changes to Average Gain and Average Loss
Each change between closing prices is sorted into one of three buckets: a positive move becomes a Gain, a negative move becomes a Loss, recorded as a positive number, and no change means zero for both. For the first RSI reading, use the first 14 periods to work out a simple average for each group: the Initial Average Gain and Initial Average Loss.
The process follows five steps used in systematic trading.
| Calculation Stage | Formula | Purpose |
|---|---|---|
| 1. Price Change | Close₍today₎ − Close₍yesterday₎ | Shows whether the period ended as a gain or a loss |
| 2. Initial average gain/loss | Σ Gains or Losses over n periods ÷ n | Sets the starting average for the first RSI value |
| 3. Smoothed average | [(Prev. Avg × 13) + Current gain or loss] ÷ 14 | Uses Wilder’s smoothing for each later period |
| 4. Relative Strength (RS) | Average Gain ÷ Average Loss | Compares buying pressure with selling pressure |
| 5. Final RSI | 100 − [100 ÷ (1 + RS)] | Turns the RS ratio into a 0–100 oscillator reading |
Relative Strength and the Final RSI Formula
Once you have both averages, divide Average Gain by Average Loss. That gives you Relative Strength (RS). Then plug RS into the RSI formula to convert it into a value on a 0–100 scale.
The simple average is used only once, for the first RSI reading. After that, every new reading uses Wilder’s smoothing. If the average loss is zero, RSI is 100. If the average gain is zero, RSI is 0.
That’s how RSI(14) is calculated; next, we look at what happens when you change the period length.
How RSI(14) Works and How Settings Change the Signal
RSI(14) uses the RSI formula on the last 14 completed periods on your chart. On a daily chart, that means 14 days. On an hourly chart, it means 14 hours.
RSI(14) is the default for a reason: it gives you a middle ground between speed and smoothness. But default doesn’t mean best for every setup. Once you’ve picked the period, the next step is deciding how fast or slow you want RSI to react.
RSI(7), RSI(14), and RSI(21) Compared
RSI(7) reacts the fastest, but it also throws off more noise. RSI(21) moves more slowly, which can help filter out small price swings. RSI(14) sits between the two.
That trade-off matters a lot when you set overbought and oversold levels. So before you move away from the default, test those settings on past market data using a systematic trader approach. A small tweak can change the kind of signals you get.
How Timeframe Choice Affects Signal Reliability
RSI settings are only one part of the picture. The chart timeframe also changes how the signal behaves. Pick the wrong timeframe, and normal price movement can look like an RSI signal when it isn’t.
On intraday SGX charts, the midday break can distort RSI and create false signals that are less likely on daily charts.
A simple way to handle this is to use a higher timeframe for trend direction, then a lower timeframe for RSI entries:
- Position Trading: Weekly for trend, daily for RSI entries
- Swing Trading: Daily for trend, 4-hour for RSI entries
- Day Trading: 1-hour for trend, 15-minute for RSI entries
Once the period and timeframe are set, traders use threshold levels to turn RSI into entry and exit signals.
Overbought, Oversold, and Common Threshold Settings
Once RSI is calculated, traders use threshold levels to help decide when to enter or exit a trade.
What 70 and 30 Mean in Practice
When RSI moves above 70, buying pressure has outweighed selling pressure, which can mean the asset is stretched on the upside. When RSI falls below 30, selling pressure has outweighed buying pressure, which can mean the asset is stretched on the downside.
That said, these readings show the strength of the current move. They do not mean price will turn right away. In a strong trend, RSI can sit in overbought or oversold territory for quite a while without reversing. That’s the part many newer traders miss when they fail to align trading goals with their overall strategy.
30/70 vs 20/80: How the Thresholds Differ
The 30/70 setting gives you more frequent signals. It’s a common starting point because it reacts sooner and gives traders more setups to work with.
The 20/80 setting is stricter. It gives you fewer signals, but those signals are often stronger because price has moved further before RSI hits the threshold.
Think of it like this: 30/70 casts a wider net, while 20/80 waits for more extreme conditions.
Adjusting RSI Ranges for Trending Markets
In strong trending markets, it helps to treat RSI extremes as context, not automatic reversal signals.
If an asset is in a strong uptrend, an RSI above 70 may simply show that buyers are still in control. In a strong downtrend, an RSI below 30 may just confirm that sellers still have the upper hand. So instead of treating these levels as a hard “buy” or “sell” trigger, use them alongside the trend.
Master Systematic Trading with Collin Seow
Learn proven trading strategies, improve your market timing, and achieve financial success with our expert-led courses and resources.
RSI Trade Signals, Confirmation, and Risk Control
The Main RSI Signals Traders Watch
Once your RSI thresholds are in place, the indicator can help with timing reversals, divergences, and pullbacks.
Threshold reversals are the signal most traders look at first. When RSI moves back above 30, it may point to a long setup. When RSI drops back below 70, it may point to a sell setup.
Divergence shows up when price prints a new high but RSI does not, or when price falls to a new low and RSI doesn’t move lower with it. That kind of mismatch can hint that the trend is losing steam and may reverse.
Pullback setups use RSI to find short-term retracements inside a trend that’s still in place.
Confirmation and risk management rules
When a signal appears, don’t jump in straight away. Check price and trend first.
RSI works best when you pair it with other tools, not on its own. You can confirm a setup with price action near support or resistance, a jump in volume, or a trend filter, such as taking only long trades when price is above the 50-day moving average. In strong trends, RSI can sit in overbought or oversold territory for some time, which is why this extra check matters.
You should also define your invalidation point before entering. If a long setup fails and price breaks below your support level, that’s your exit. If your losing trades keep ending up bigger than your winners, your stop-loss and exit rules are probably too loose and need tightening.
Keep position size small enough that any one loss stays contained. ATR-based sizing can help match your risk to current volatility.
Set your stop-loss and target before entry. That keeps your process disciplined and makes it easier to handle market swings with a steady hand.
Conclusion: Key Points to Remember
Here’s what matters most when you use RSI.
RSI is a 0–100 momentum gauge that compares recent gains with recent losses. RSI(14) is the standard starting point, but faster or slower settings change how fast it reacts. The 30/70 and 20/80 thresholds are guides, not hard rules. In strong trends, RSI can stay at extreme levels longer than you might expect.
That’s why it helps to use RSI with trend and momentum indicators for confirmation and pre-set risk limits before acting on any signal.
Used this way, RSI is a timing tool, not a standalone trigger.
FAQs
When should I use RSI(7), RSI(14), or RSI(21)?
Use the RSI period that fits your trading style. RSI(7) or RSI(9) works well for day traders who want faster signals. RSI(14) is the standard setting and gives a more balanced read for general use.
If you want to cut out more market noise and pay attention to broader trends, RSI(21) may suit you better. Whatever setting you pick, stick with it so your analysis stays consistent and reliable.
Why can RSI stay overbought or oversold for so long?
In strong trends, the market can keep moving in one direction. That means RSI’s 0–100 momentum reading can stay near the edges of its range for a long stretch, even if price doesn’t reverse any time soon.
Overbought doesn’t mean price has to fall. Oversold doesn’t mean price has to rise.
That’s why many traders don’t treat an extreme RSI reading as an automatic buy or sell signal. They usually wait for extra confirmation first, like RSI starting to weaken or showing divergence.
How do I confirm an RSI signal before entering a trade?
Don’t rely on extreme RSI readings alone. They can throw off false signals. A better move is to wait for RSI to cross back through the overbought or oversold zone before acting.
If you want more confirmation, look for confluence with things like MACD crossovers, volume spikes at 1.5 to 2.0 times the average, divergence, or price action signals near support or resistance.