About the Security (NASDAQ: INTC)
Intel Corporation is an American multinational technology company headquartered in Santa Clara, California. Intel designs, manufactures, and sells computer components such as central processing units and related products for business and consumer markets, according to Wikipedia.
It was reportedly the world’s third-largest semiconductor chip manufacturer by revenue in 2024.2.
Stock background:
Intel shares have shed 40% after hitting a record high in June. Does this mean the stock’s uptrend is over? Probably not, at least as per our proprietary TGPS system.
Part of the reason for the decline is Intel’s massive $20 billion public share offering priced at $95, raising concerns regarding dilution of equity. Furthermore, the company’s Foundry division, despite new partnerships, has clocked a $2.1 billion operational loss in the second quarter.
Even after the recent correction, Intel shares are up close to 400% since August, thanks to the exuberance in chip stocks. Some of the exuberance seems to have come off recently ahead of Nvidia’s quarterly earnings due August 26.
Around mid-August 2025, we highlighted Intel as a potential stock to watch. See “Intel: Preparing to Take Off?”, dated 20 August 2025. In October 2025, signs were emerging that a meaningful bottom was in place – “Intel: A Meaningful Turnaround,” published 9 October 2025.
Intel (Weekly):
Technical Analysis on Intel Inc (NASDAQ: INTC)
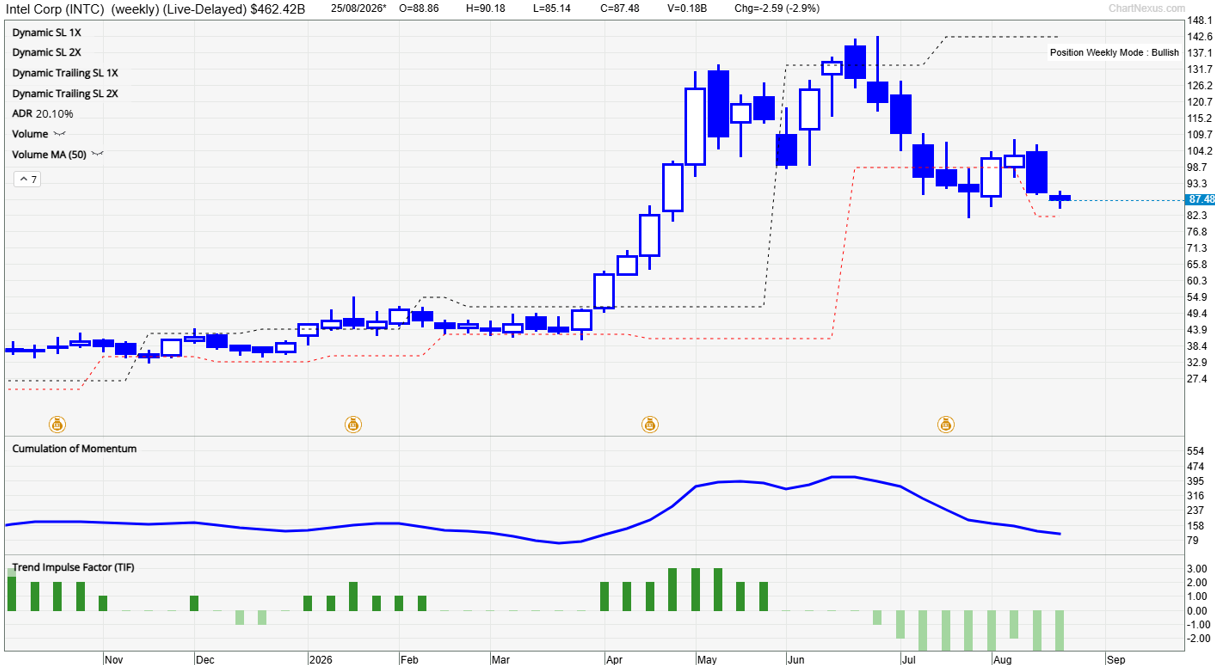
Our proprietary system TradersGPS (TGPS) continues to remain bullish on the stock on the weekly timeframe. As the accompanying chart shows, the candle colour has been blue since mid-2025. Blue candles indicate the stock’s trend is up. Red candles indicate the trend is down.
A key highlight of the TGPS system is that it has been able to capture the entire uptrend, giving subscribers a chance to participate in the trend. The system tends to be especially suitable for passive investors as it is less driven by ‘noise’.
Intel (Weekly):
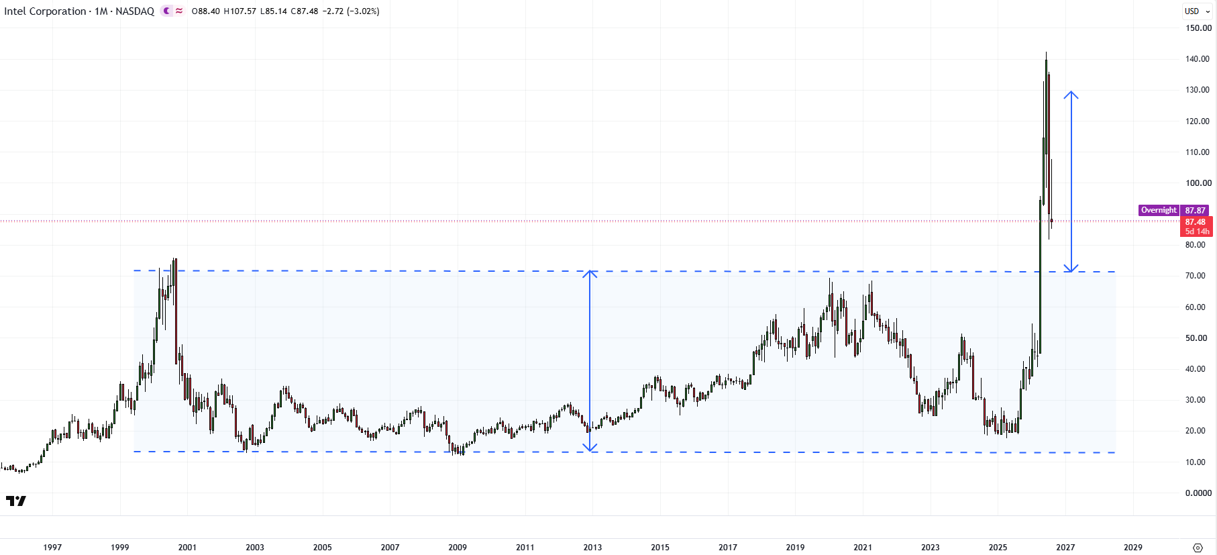
On technical charts, Intel’s rise to 130 coincided with the target of the near-three decade sideway pattern. However, the upward pressure has eased somewhat, given the recent sharp retracement.
Key support is at the July low of 82. Any break below would raise the risk of a change in the uptrend; that is, the trend would change to sideways. A break below 70 is needed for the uptrend to break down.
We haven’t highlighted any trading strategy on Intel in recent updates, so I’m unable to comment specifically with regard to levels.
Subscribers of the TGPS system can wait for the candle color to turn Red on the weekly chart. Once the colour changes to Red, it might be worth taking some cash off the table.